

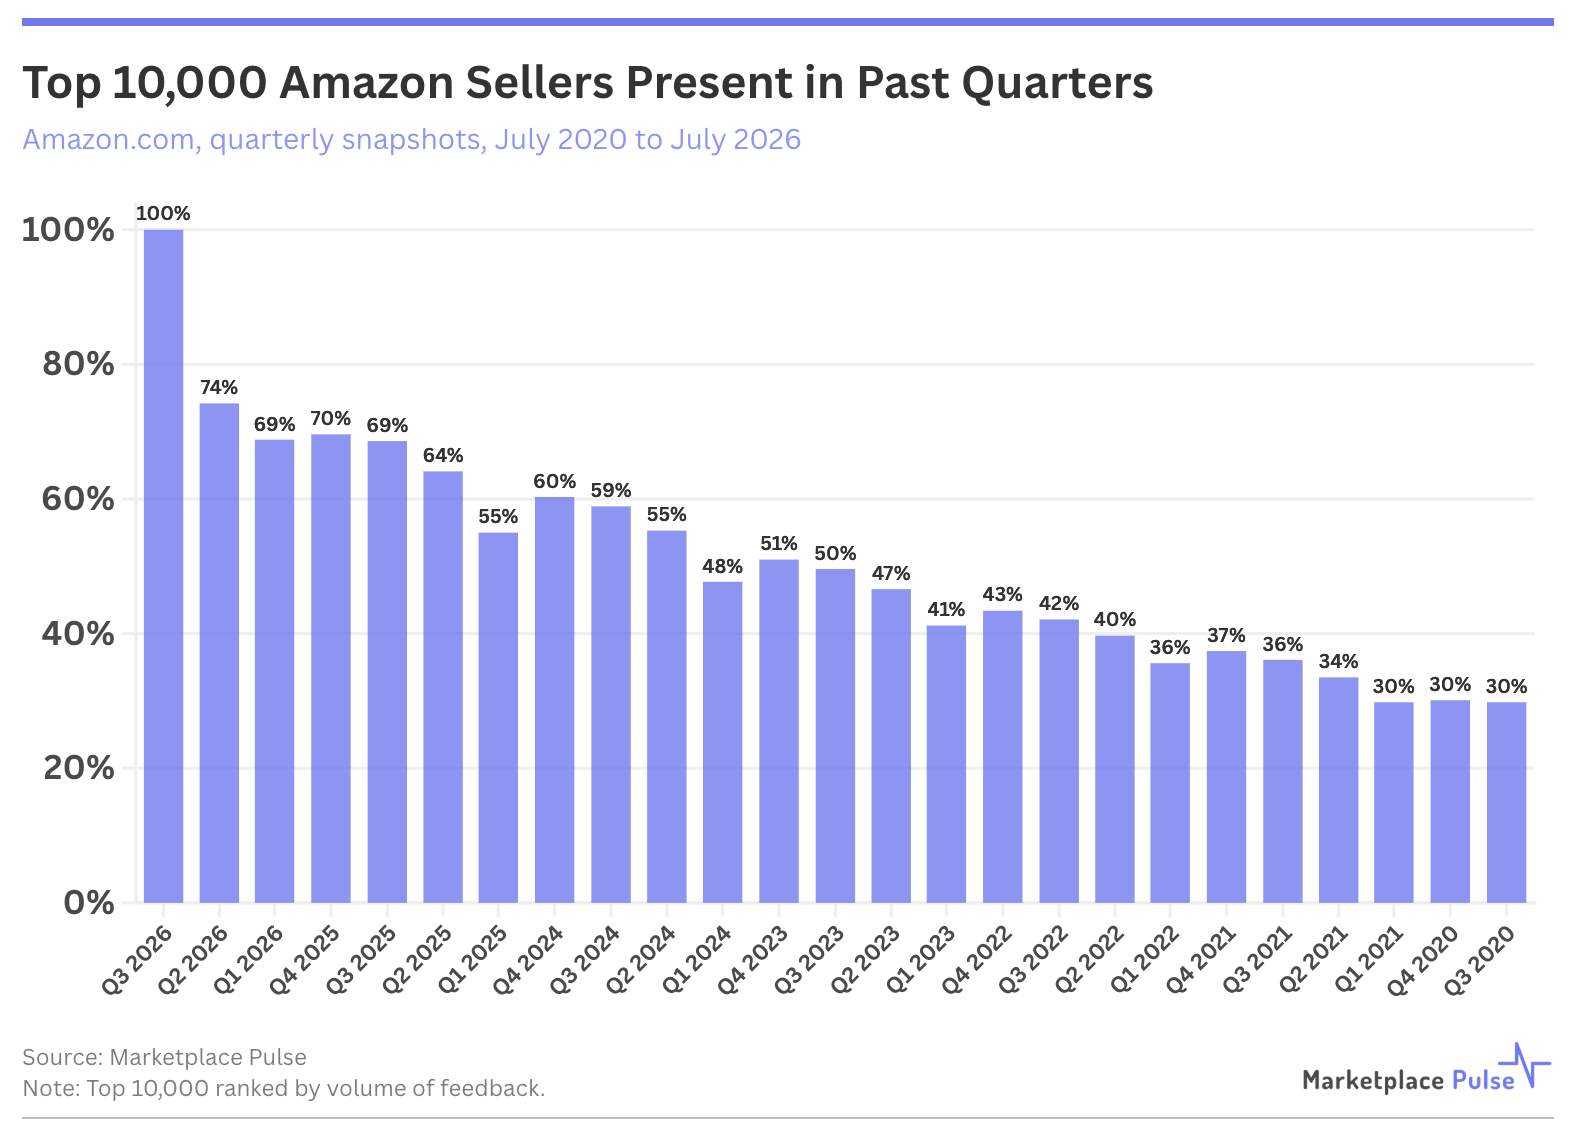
The top 10,000 sellers on Amazon.com turn over at almost precisely the rate they did seven years ago. 68.6% of today’s top sellers held the position a year ago, against the 67% Marketplace Pulse recorded in 2019. Nearly half – 49.6% – were already there three years ago, up from 41% in 2019. Holding a top position has become more durable, not less. What has not held is who occupies it.
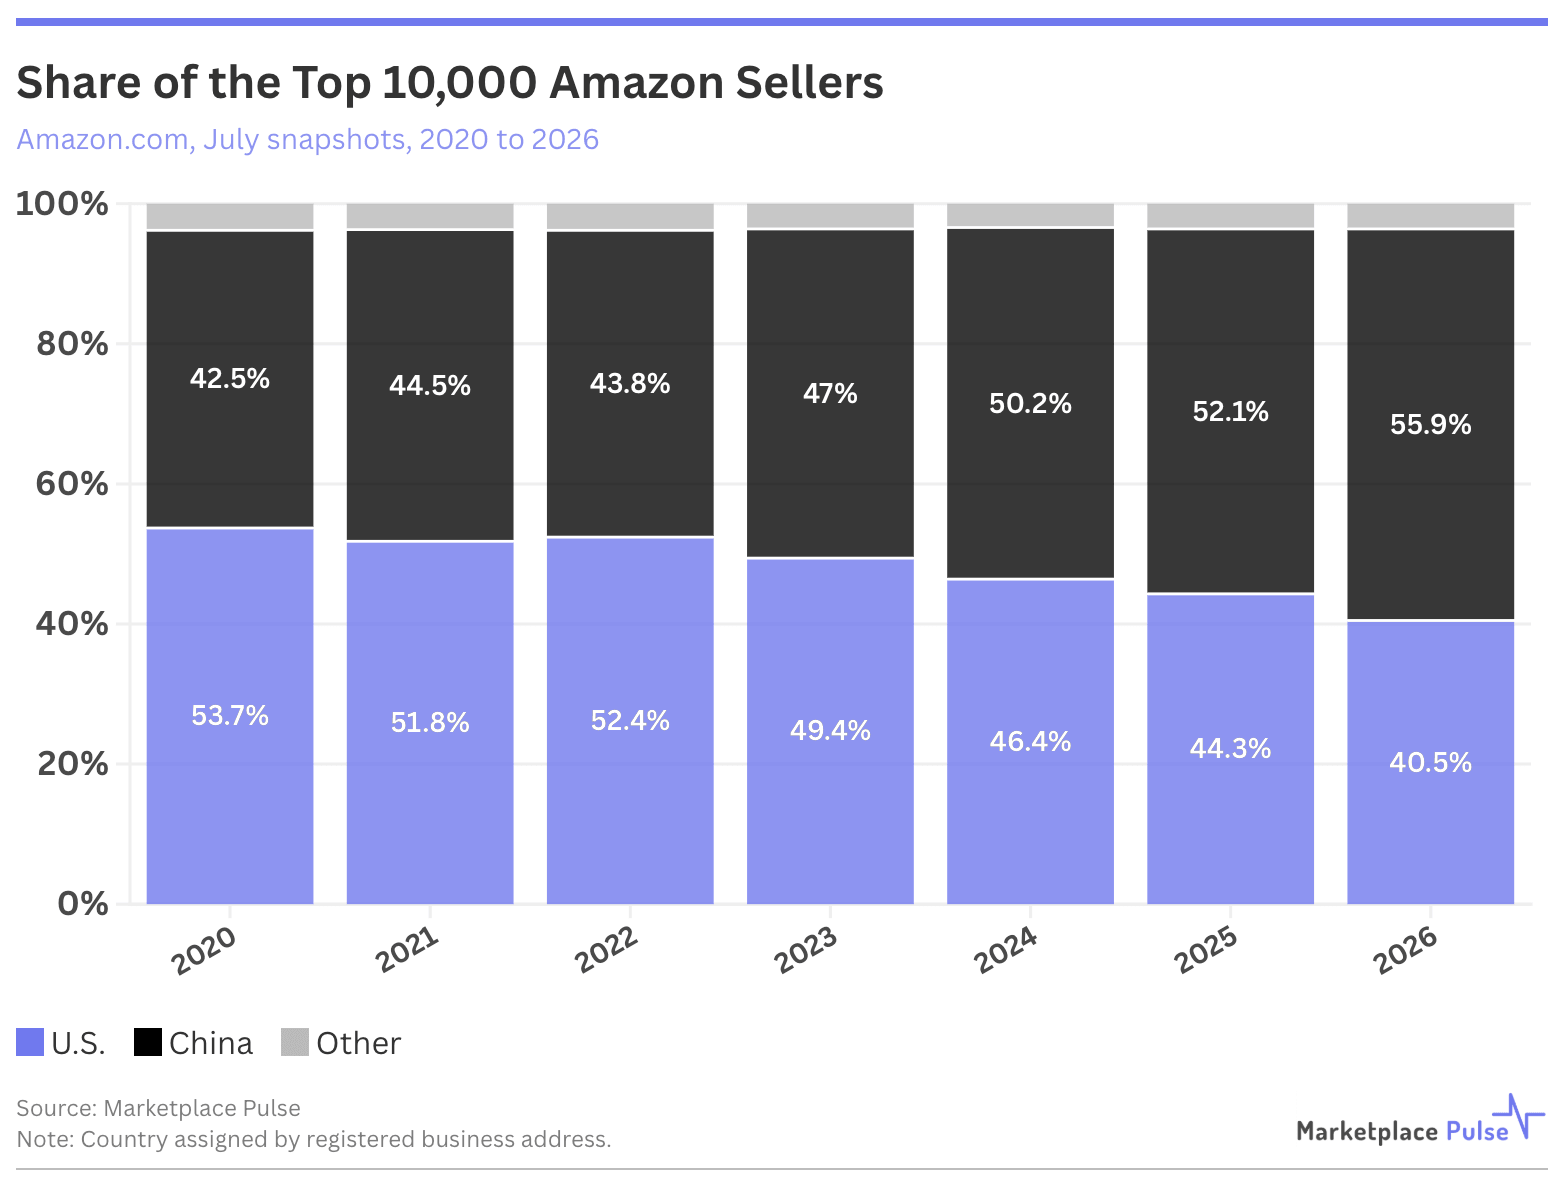
Chinese sellers have gained 1,342 positions in the top 10,000 since July 2020; U.S. sellers have lost 1,320. Chinese sellers were 42.5% of the cohort then and are 55.9% today, while American sellers fell from 53.7% to 40.5%. The crossover arrived at the top of Amazon.com roughly two years before Chinese sellers reached a majority of the global active seller base, and 3.8 points of share moved in the past twelve months alone.
The veteran cohorts have thinned in parallel. Half of today’s top sellers registered before 2019, down from over 60% a year ago. Pre-2016 sellers hold 21.9% of top positions and 2016-2018 sellers 27.4%. Against them, 26.9% registered between 2022 and 2024 and 6.3% arrived within the last eighteen months. The thinnest cohort is 2019-2021, at 17.5% – a pandemic vintage that entered at the marketplace’s peak and has been squeezed from both directions since.
The sellers replacing them are increasingly Chinese – arriving with manufacturing proximity, direct factory relationships, export subsidies, and AI tooling that erased the listing-quality gap once protecting domestic sellers. They also arrive into a different marketplace. Veterans built rank through organic position and review history; that real estate has steadily given way to sponsored placement, and factory-direct entrants operating on thinner product margins outspend them for it. The seats turn over at the same rate they always have. What has changed is who is waiting to take them.
Headcount overstates the reversal, though. U.S. sellers hold 65.3% of the GMV this cohort generates against 28.6% for Chinese sellers, an inversion of their headcount positions. The advantage concentrates at the summit: American sellers are 81.4% of the top 100 and produce 93.2% of its GMV, but only 34% of the 5,001-10,000 band. Their average selling price exceeds Chinese sellers’ at every rank, most starkly in the top 100 at $47.62 against $22.03.
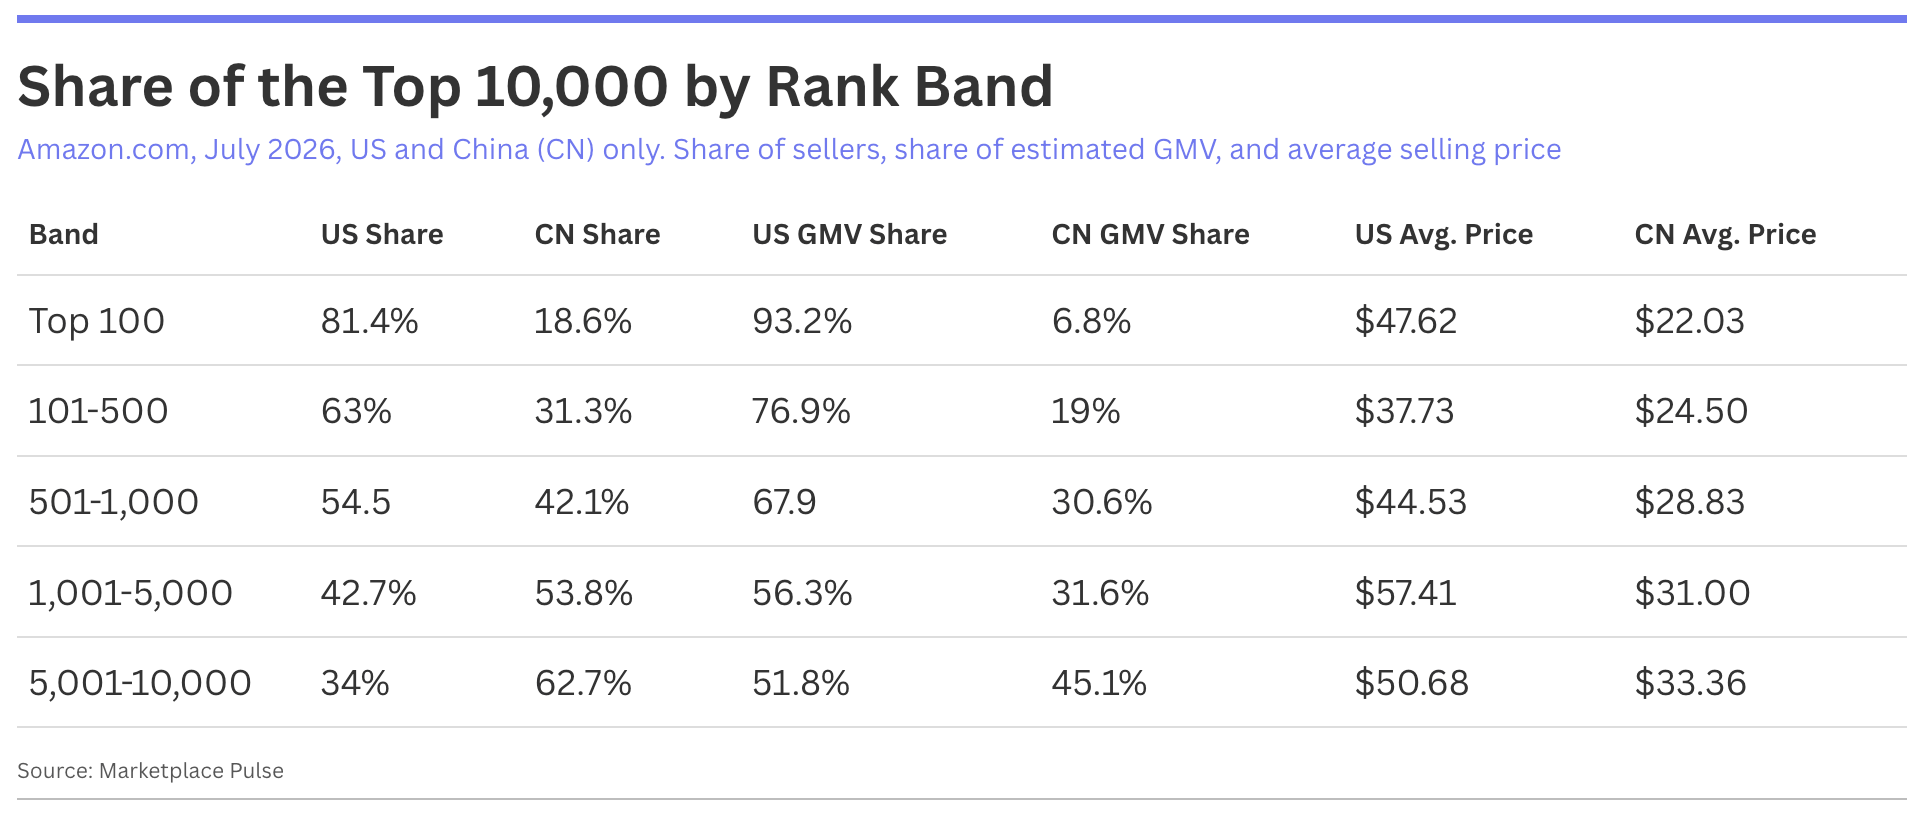
Chinese sellers have won the top 10,000 by count while American sellers retain its most valuable ranks. The concentration is not Amazon’s alone – the top 1% of TikTok Shop sellers drive 60% of U.S. GMV, a steeper curve on a platform built to flatten outcomes.
Marketplace Pulse concluded in 2019 that it takes years to build a lasting business on Amazon, but once built, sellers can maintain it for years. The first half holds. Time on the platform still compounds into advantage, but less of it, and for fewer sellers. Longevity has gone from the defining characteristic of the top to one attribute among several.


