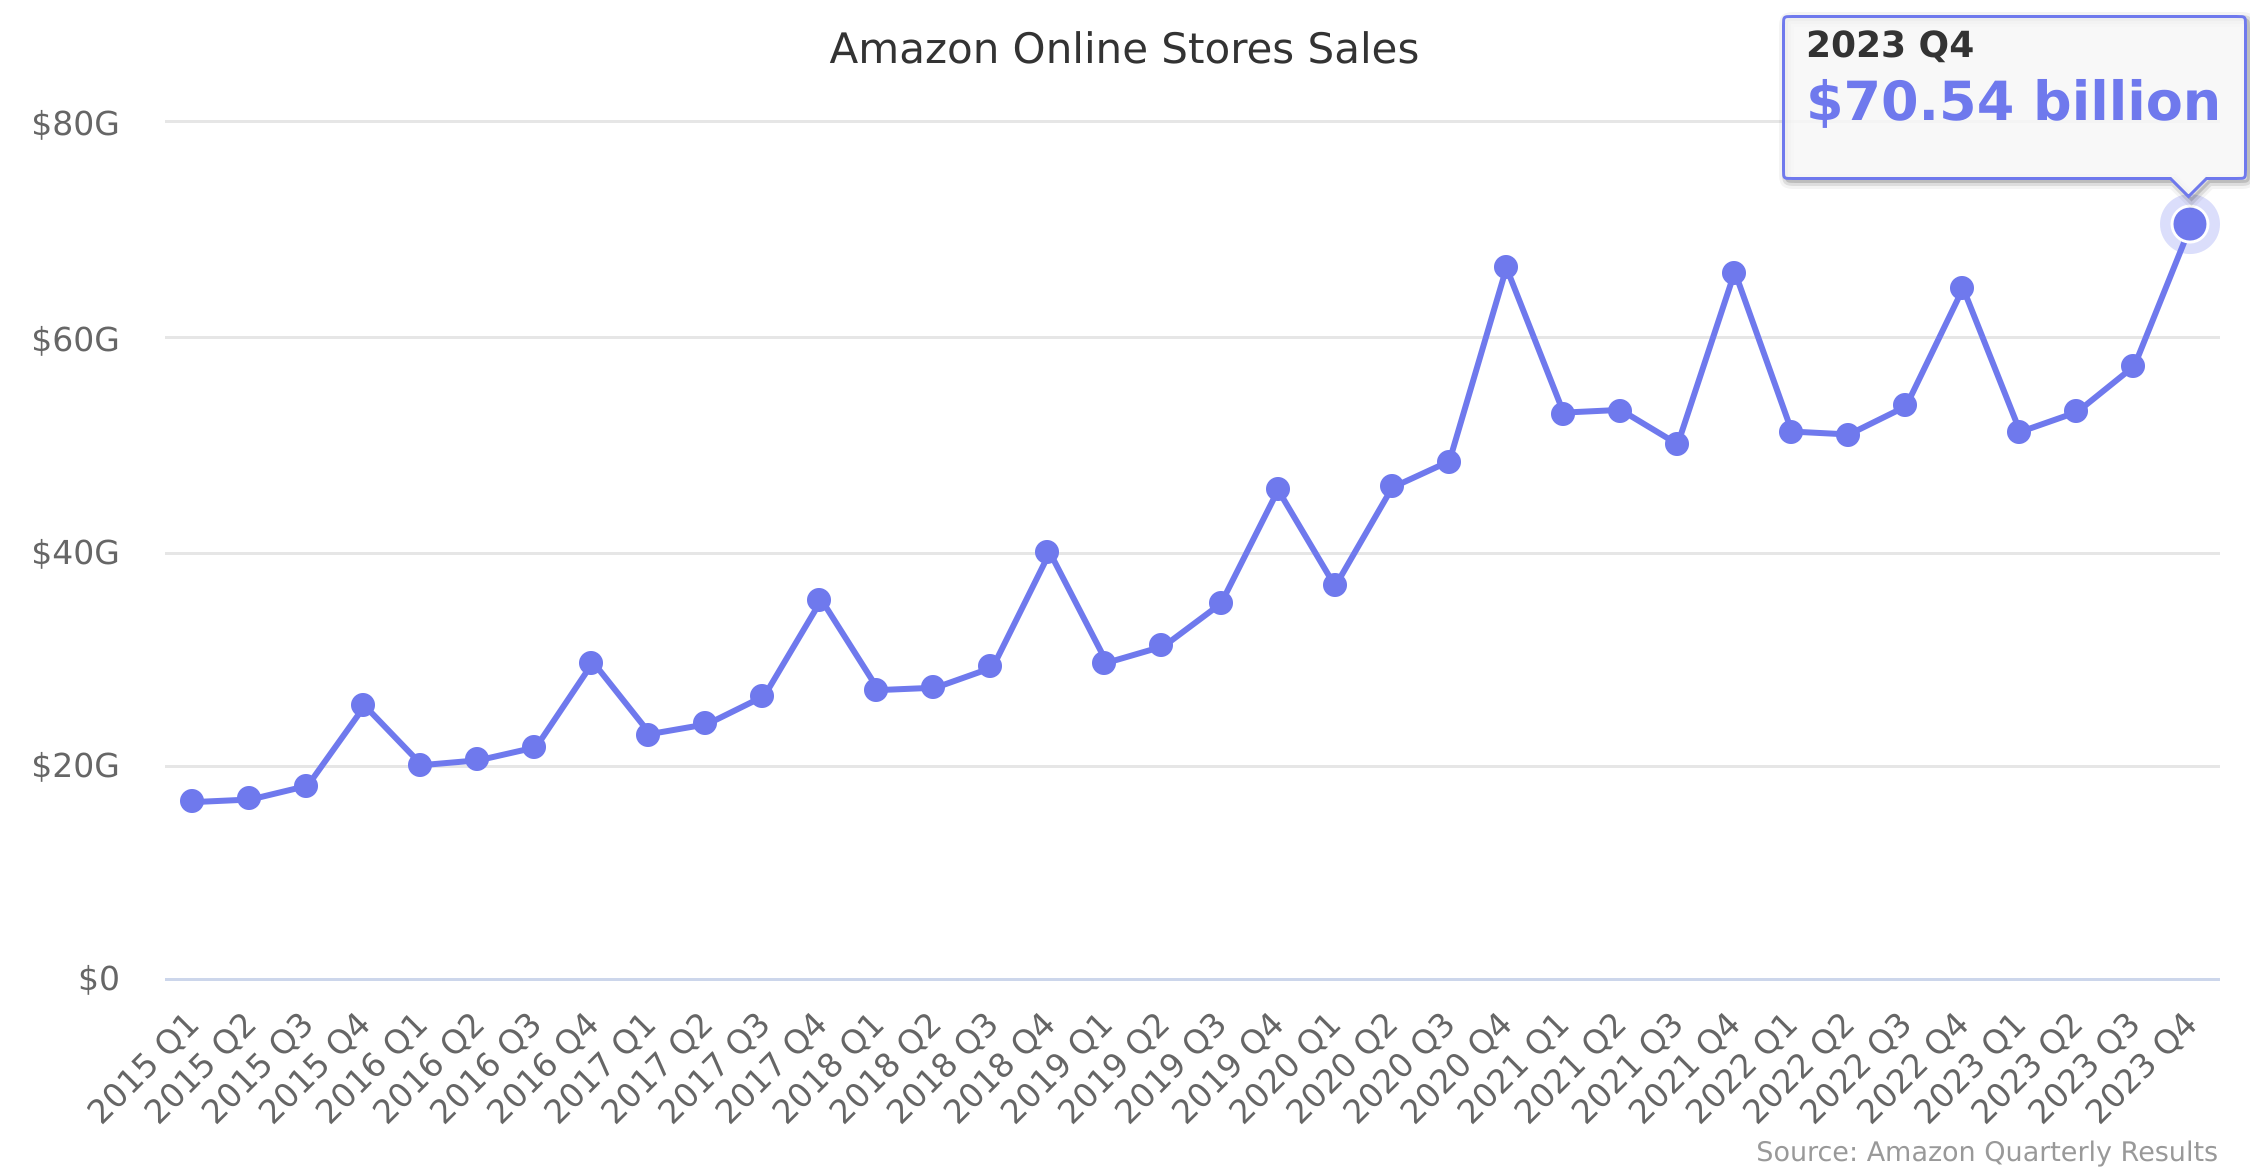
Amazon Online Stores Sales
Amazon defines this as:
Includes product sales and digital media content where we record revenue gross. We leverage our retail infrastructure to offer a wide selection of consumable and durable goods that includes electronics and general merchandise as well as media products available in both a physical and digital format, such as books, music, video, games, and software. These product sales include digital products sold on a transactional basis; digital product subscriptions that provide unlimited viewing or usage rights are included in Retail subscription services.
2014: $68.513 billion, 2015: $76.863 billion, 2016: $91.431 billion.
Last reported quarter 2026 Q1 it was $64.25 billion, up by 12% year-over-year from $57.41 billion. From $247.03 billion in 2024 it increased by 9% to $269.30 billion in 2025.
Other Amazon Statistics
- Amazon Advertising Services Sales
- Amazon Paid Units Growth
- Amazon Net Income
- Amazon Subscription Services Sales
- Amazon Third-Party Seller Services Sales
- Amazon Net Sales
- Amazon Percentage of International Sales
- Amazon Net Product Sales
- Amazon International Sales
- Amazon North America Sales
- Amazon Percent of Units by Third-Party Sellers