The conventional narrative fixates on gross merchandise volume as the ultimate indicator of marketplace potential. By that logic, Amazon’s U.S. marketplace, with an estimated $305 billion in third-party GMV, dwarfs everything, and the conversation ends there. But a single-metric focus misses the fundamental question: where can sellers build a sustainable, profitable business?
Our newly published Amazon Marketplaces Trends Report uses a proprietary scoring framework powered by Marketplace Pulse data to evaluate opportunities within the eleven core Amazon marketplaces, which each generate over $5 billion third-party GMV.
The framework is made up of seven dimensions:
- Revenue (average seller earnings)
- Traffic (customer visits per seller)
- Longevity (long-term seller survival rates)
- Diversity (geographic seller concentration)
- Distribution (revenue balance across seller tiers)
- Activation (new seller success rates)
- Scale (speed to million-dollar revenue)
These dimensions are then synthesized into a Total Opportunity Score weighted toward factors that actually determine business opportunity. The resulting rankings reveal a more nuanced reality than GMV alone could capture.
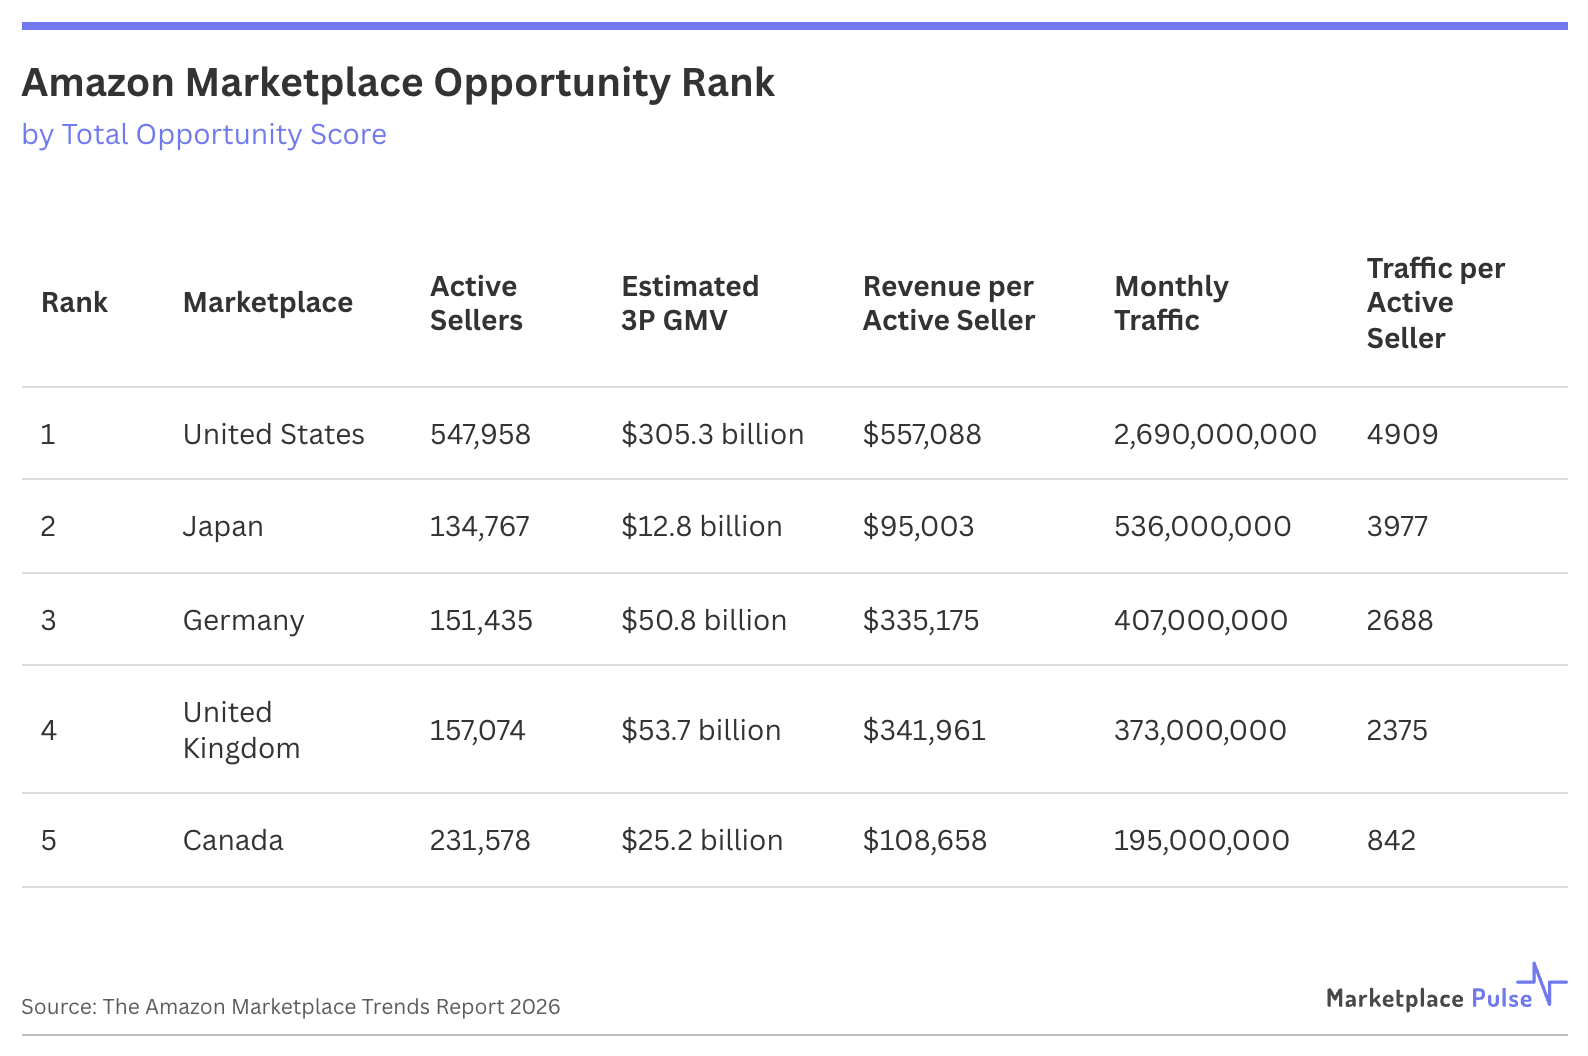
The United States unsurprisingly tops our rankings with 547,958 active sellers generating $557,088 revenue per seller – more than $200,000 above any other major market. But, beyond revenue, additional stories emerge. The highest Activation Score across all marketplaces is driven by 60% of new sellers achieving their first sale within 12 months, compared with 8% in Mexico and 24% in Italy. This is a benefit of volume, of course, but it’s also the result of the micro-niche viability enabled by 2.69 billion monthly visits. Traffic per seller of 4,909 visits creates opportunities for specialized products that simply cannot exist elsewhere. A business selling sourdough starter jars works in America because search volume supports it. That same business fails in Australia, where those searches don’t exist.
Japan’s second-place ranking defies conventional wisdom. Its $12.8 billion GMV ranks eighth globally – smaller than Spain, Mexico, and Brazil. Yet Japan’s high Longevity Score reveals exceptional seller sustainability once established. Of sellers active five-plus years ago, 15.5% remain active today, versus the next highest marketplace, Canada, at 12.4%, and just 7.8% in the U.S. The 134,767 active sellers generate a modest $95,002 average revenue, but 3,977 visits per seller demonstrates concentrated consumer attention. The marketplace rewards cultural mastery over operational scale, creating long-term, defensible competitive positions through adaptation rather than volume.
Germany’s third-place position reflects Europe’s fundamental trade-off between barrier and moat. At $50.8 billion GMV across 151,435 sellers, it delivers $335,175 per seller – Europe’s second-highest. However, the 2,688 visits per seller falls short of the U.S. benchmark, and its Longevity and Activation Scores are modest given the associated regulatory complexity. Germany operates as Europe’s proving ground, where mastering complexity in one market simplifies expansion across less stringent neighboring countries.
The United Kingdom ranks fourth through sheer revenue performance despite structural challenges. Brexit played a role in stunting the UK’s Activation Score, yet $341,961 per seller across 157,074 accounts makes it Europe’s largest revenue opportunity. The 2,375 visits per seller – the lowest among the top-five markets – forces optimization over volume-based strategies. The shared language makes it the strategic European entry point despite post-Brexit regulatory complexity.
Canada rounds out the top five through sustainability metrics that contradict its modest scale. The $25.2 billion GMV spread across 231,578 sellers yields just $108,658 per seller – seventh globally. Yet its strong Longevity Score demonstrates business viability. The catch: 842 visits per seller creates a traffic-constrained environment demanding ruthless optimization. As such, the marketplace serves as an efficient testing ground where relative ease of expansion meets volume limitations – the ideal environment for conservative expansion.
Opportunity lies at the intersection of multiple factors, not in headline GMV figures alone. Markets with exceptional traffic efficiency, balanced revenue distribution, and strong activation rates deliver better seller outcomes than larger markets with extreme concentration and poor new-seller success rates.
–
This analysis is part of our newly launched Amazon Marketplaces Trends Report - download your copy free here.