
2021 was the year of broken supply chains, Amazon aggregators, more advertising, Shopify’s almost-marketplace, and one unanswered question - did the pandemic boost e-commerce after all? For now, the world of marketplaces revolves around Amazon - it has doubled in size in two years. No one will challenge it directly, but a different paradigm might.
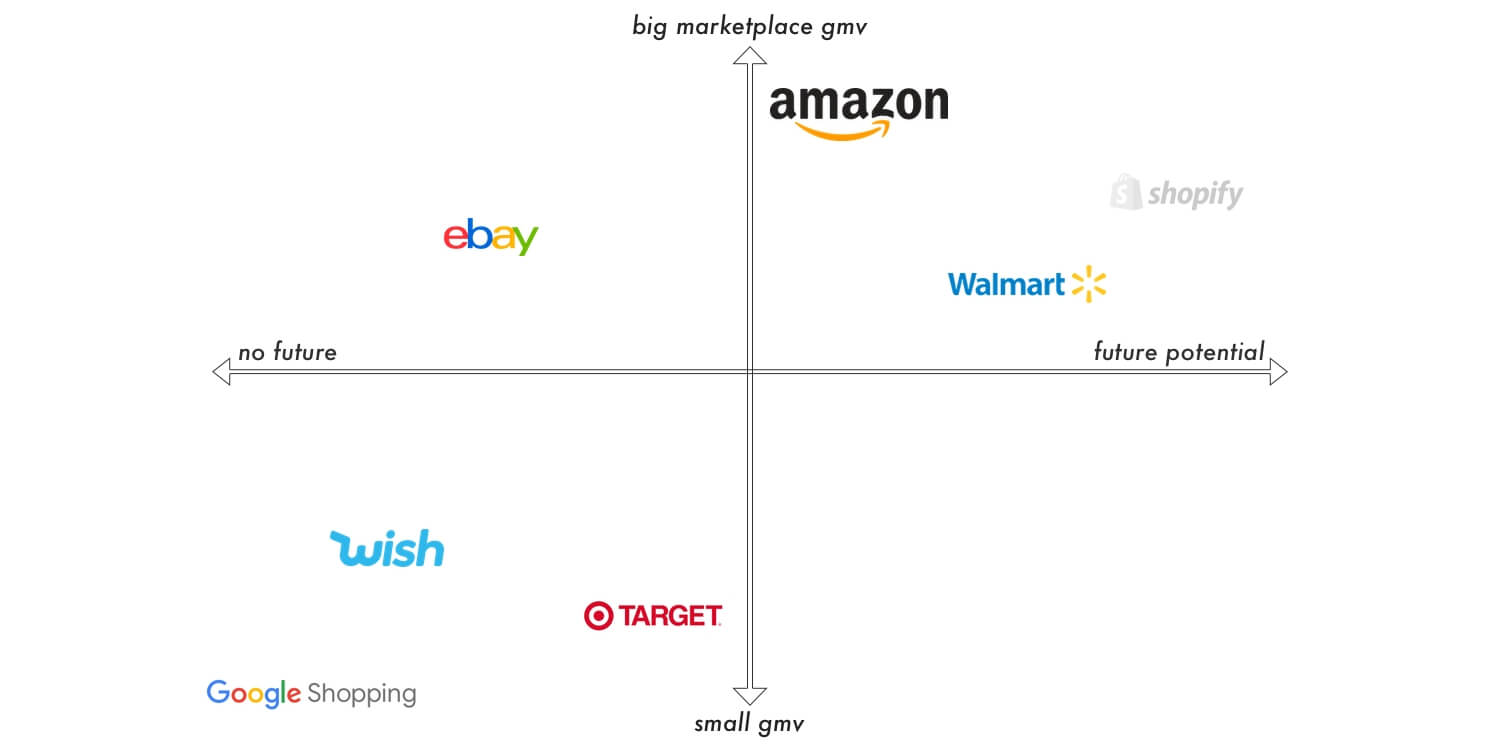
It is often shocking how centralized the industry is around Amazon. When considering marketplace GMV and future potential, the list grows tiny. Amazon is at the top, eBay near it (but struggling to regain relevance), and then there is Walmart. There are no other marketplaces. Wish, Google Shopping, Target, and others promised marketplaces but didn’t deliver. Wish still primarily consists of Chinese sellers, and the app made zero progress in turning that around. Google Shopping looked like it was building a marketplace, but after Google yet again reshuffled the strategy, it went back to being a price comparison engine. Target performed great but remained an invite-only marketplace of a few hundred sellers.
The market has instead evolved from the marketplace seller to a brand-builder. That’s what Shopify represents, despite not being a marketplace. While many Amazon-focused sellers continued to wait for the next company to challenge Amazon and thus allow them to diversify, the next it turned out to be direct-to-consumer. Instead of expecting Target, Wish, Google, eBay, and many other companies that promised to be challengers to deliver, the opportunity arrived in the form of Shopify. The concept of an “Amazon seller” or a “marketplace seller” is the past. The now is sellers.
This report is a selective collection of stories, insights, and data. There are hundreds more marketplaces, especially internationally, and thousands of topics that it doesn’t include. Unless otherwise noted, all data discussed is Marketplace Pulse data, while the financial data comes from companies’ quarterly financials. There are inherent limitations to estimating many behaviors on marketplaces; thus, the direction of changes is often more telling than the point-in-time value.
It looks at the growth of e-commerce and global supply chain issues. Amazon’s GMV growth versus Shopify’s attempts at a marketplace. The industry of Amazon aggregators and the impact of Amazon advertising. Social platforms’ effect on shopping and the role of Amazon as the default search engine for e-commerce. The success and growth of third-party sellers, the brands those sellers are building, and the growing presence of sellers from China. Finally, Amazon’s twenty marketplaces and the status of Walmart, Target, Etsy, eBay, and Wish marketplaces.
Contents
- Introduction
- Did the pandemic boost e-commerce?
- Broken Global Supply Chain
- Amazon Gross Merchandise Volume (GMV)
- Shopify's Almost-Marketplace
- Amazon Aggregators
- Advertising
- Seen on Netflix, Sold on Amazon
- Amazon Is the Default Search Engine
- Amazon Sellers
- Revolving Door of Brands
- Chinese Sellers
- Twenty Amazon Marketplaces
- Other Marketplaces
- The Future
Did the pandemic boost e-commerce?
U.S. e-commerce penetration in Q3 2021 was at levels it would have likely reached even if the pandemic didn’t happen. While Covid boosted e-commerce spending in 2020, that acceleration perhaps wasn’t a step-change after all. The lockdowns of 2020 led to a lot of forced e-commerce and online grocery adoption, and considerable growth was pulled forward. Online spending in the second quarter of 2020 was up more than 40%, the fastest growth in decades. But as offline retail recovered, the e-commerce role in U.S. retail seemed to fall back.
Every year e-commerce gets a little bigger, and the pandemic made it a lot bigger for a while. But as things started to calm down, e-commerce got back to the trend line it was on for over a decade. According to the Department of Commerce, e-commerce represented 12.4% of total retail spending in Q3 2021. Before the pandemic and given average growth over the past five years, it would have been 12.6%.
However, shoppers were still spending more online. In the third quarter, e-commerce spending was $204 billion. Before the pandemic, the trend line would have put it at $183 billion. The e-commerce market share is nearly identical to pre-pandemic expectations because offline retail spending had also surged - total retail spending was up 13%, following two decades of 2-3% growth. Shoppers were spending more online and offline.
The pandemic didn’t end in 2021, and global supply chain disruptions brought new headwinds. It could turn out that e-commerce penetration growth will look like a “J curve” in the future - an economic theory that says a period of negative returns is followed by a period of gradual recovery that rises to a higher point than the starting point. Maybe after the e-commerce boost in 2020, 2021 was the recovery year before it accelerates again. But it could very likely continue to instead grow at the 14-15% average it did during the decade leading up to the pandemic.
While the U.S. e-commerce spending of $204 billion in the third quarter was up 11% from the trend line, different retailers experienced varying step changes. Amazon’s first-party sales, for example, were only up 4% from their trend line. On the other hand, Etsy was up 69% - one of the few companies that experienced a measurable step change. Shopify and eBay were somewhere in-between - up 24% and 35%, respectively. Before the pandemic, eBay experienced years of decline. However, all four companies and, more broadly, U.S. e-commerce were inching closer to their trendlines by the end of 2021.
Broken Global Supply Chain
Importing goods from Asia got significantly more expensive and slower. Ocean freight rates on goods shipped to the U.S. from China increased five times in 2021. Compared to rates pre-pandemic, they were up ten times. Container freight rates increased from $1,500 at the start of 2020 to over $20,000 in September 2021. By the end of 2021, the rates started to drop, but only to $15,000. Port closures, labor shortages, bottlenecks, typhoons, demand imbalance, and container shortage are just some of the reasons behind the massive increase in price.
Goods were taking nearly twice as long to reach warehouses in the U.S. compared to the start of 2020. Up to almost 80 days from the typical 40. The most visible cause was the number of cargo ships waiting to dock outside of major ports - a number that kept creeping up for most of the year. After years of progression towards a just-in-time retail model - low quantity levels in warehouses, frequent imports - the industry had to adjust. Rising freight rates and slower imports meant sellers had to rethink cargo routes, freight methods, and manufacturing locations. And ultimately raise prices to account for rising costs while also trying to stay in stock.
Despite disruptions to global supply chains and Amazon’s warehouse space restrictions implemented in 2020, inventory levels at Amazon warehouses were high. 83% of the top sellers on Amazon.com had most of their inventory stored in FBA, only slightly down from 84% in 2020. The Prime availability index of the top sellers acts as an indicator for the overall Prime-enabled catalog. In 2020, from May to July, it reached a twelve-month low. At the time, the Prime assortment had decreased because, on March 17th, 2020, Amazon started prioritizing the stocking of household staples and medical supplies, letting other items run out of stock.
As other retailers feared empty shelves, Amazon turned its vast marketplace into an advantage. Some sellers could not get items imported on time or gave up on orders because of increased freight rates and limited Amazon’s warehouse space, and ran out of stock before new inventory could be checked-in. But since many sellers compete with hundreds or more selling similar items, shoppers likely didn’t catch that. Suppose the product a shopper wanted from seller A was no longer available because they’ve run out. Thousands of other sellers offered near-identical products and stepped in to satisfy that demand.
Amazon built more warehousing space and hired more people than ever before to catch up with the increased fulfillment demand. Amazon was “on track to double our fulfillment network over the two-year period since the pandemic’s early days. A lot of this increased capacity supports our FBA sellers,” said Brian Olsavsky, CFO at Amazon, during the third-quarter earnings call. And that in the quarter, “labor became our primary capacity constraint, not storage space or fulfillment capacity.” That didn’t entirely remove Amazon’s inventory quantity restrictions it implemented while storage space was under capacity. But Amazon did catch up with the demand.
Amazon Gross Merchandise Volume (GMV)
According to early estimates, in 2021, sellers on the Amazon marketplace sold $390 billion worth of goods, adding nearly $90 billion net growth in a year. It grew faster in 2020, but even with slower growth in 2021, the marketplace doubled in two years - from $200 billion in 2019 to $390 billion in 2021. The total gross merchandise volume (GMV), including sales by Amazon itself and by the marketplace, was north of $600 billion. However, most of the growth came from third-party sellers, not first-party sales. Amazon’s retail sales were up 14%, while the marketplace grew nearly 30%.
Sales by sellers represented as much as 65% of Amazon’s total GMV. Ten years ago, in 2011, they were 38%.
If sales by sellers were Gross Domestic Product (GDP), that would make the Amazon marketplace the 37th-largest economy globally, just behind Denmark but ahead of Malaysia. However, it isn’t only the sales volume that makes marketplaces comparable to economies. The number of people served as consumers, businesses reaching those consumers, jobs created, and vendors supporting them make marketplaces like economies. The textbook definition of an economy also nearly matches marketplaces.
As big as the Amazon marketplace has gotten, Shopify was growing faster. Shopify was the size of 45% of the Amazon marketplace. It was just 25% two years ago in 2018. The important thing is not whether Amazon and Shopify are comparable - they are not - but the readiness of brands to sell directly to consumers. “Amazon versus Shopify” is not a consideration consumers make but a choice sellers make.
The growth of Shopify signifies the viability of direct-to-consumer retail. When Shopify was founded fifteen years ago in 2006, the Amazon marketplace was perhaps the most efficient channel small brands and retailers could use to reach consumers. Online advertising and social networks grew in parallel to enable a different way of shopping. Shopify wouldn’t have gone as far without Google, Facebook, and Instagram.
Amazon overtook Walmart - shoppers spent more on Amazon marketplaces than Walmart stores. It was a milestone moment, a passing of a baton of sorts. What makes it more remarkable is that most Walmart sales happen in offline stores, a category of retail that is still an order of magnitude bigger than online. Nonetheless, Walmart said that their global e-commerce sales reached $75 billion in 2021.
Shopify’s Almost-Marketplace
Shopify continued to insist that they wouldn’t build a marketplace. “There’s an absolutely obvious playbook for Shop that I think everyone can see,” said Tobi Lütke, CEO of Shopify. The obvious playbook Tobi referenced is most likely a marketplace. He went on to say that Shopify doesn’t want to follow it. In an interview with Harley Finkelstein, president of Shopify, Niel Patel of The Verge asked, “Do you see yourself headed in that more consumer direction, where you run basically a catalog for lots of independent businesses?” Harley answered, “No. We have no plans to be a marketplace.”
And yet, Shopify slowly continued adding functionality that brought the app closer to a marketplace. When the app launched in April 2020, it didn’t have a shopping cart or in-app checkout. Clicking on items would open a pop-up window with the merchant’s website page. Those became native features, allowing shopping without ever leaving the app. The app satisfies the definition of a marketplace - the app enables discovering merchants, adding their items to a shopping cart, and checking out.
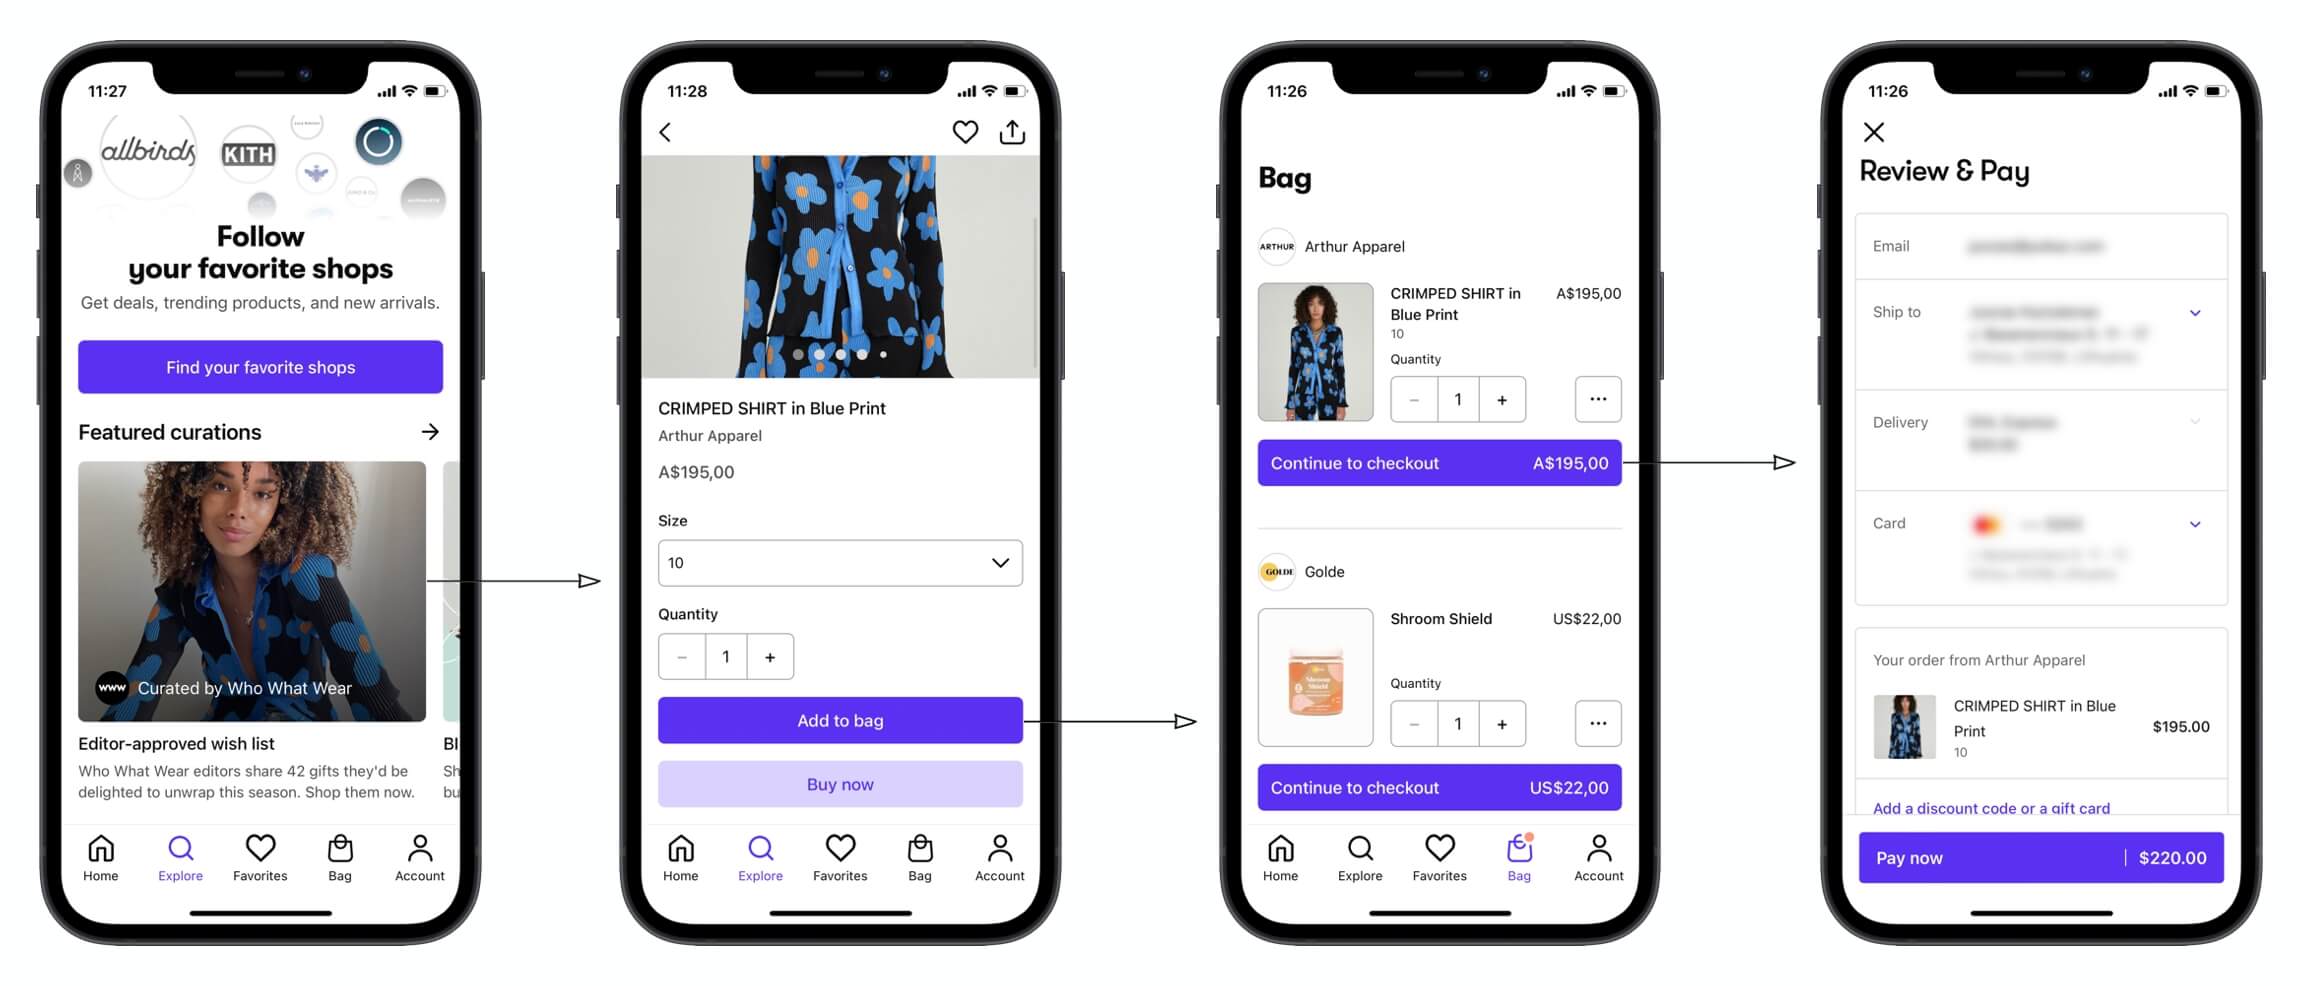
The missing piece is the ability to search for items rather than merchants - the app doesn’t allow finding sweaters across all Shopify merchants. It shows merchants with “sweaters” in the title instead. But Shopify was piloting a feature that solved this. “Shopify is quietly testing a new search feature that allows customers to search for items across Shopify merchants — meaning products from competing brands would show up alongside one another,” wrote Madeline Stone for Business Insider. However, universal search means a ranking algorithm and deciding what metrics influence higher ranking. Eventually, universal search also means an advertising platform for merchants who want to pay to rank higher.
Shopify doesn’t have a clear direction for the app, but meanwhile, it was getting millions of downloads a month because Shopify featured it in post-purchase emails. More people downloaded the app than Walmart’s, Nike’s, Target’s, and practically everyone else’s except Amazon’s. If Shopify rolled out the universal search to everyone, the Shop app would - because of the tens of millions of shoppers that downloaded it - immediately generate significant GMV. But not nearly substantial enough to impact broader e-commerce.
Shopify, perhaps unintentionally, has built a marketplace. But, as Tobi Lütke said, that’s the “obvious” playbook. A playbook that won’t disrupt the e-commerce stats quo. Becoming more like Amazon when trying to compete with Amazon seems aimless. And marketplace functionality is not enough to make Shop a shopping destination. Shopify might have all of it in place, but it doesn’t have a value proposition to shoppers. Millions of Shopify merchants wrapped in universal search is not it. The app wouldn’t replace Amazon or other retailers because its selection is spotty. Nor could it focus on just a few categories because that is already done well by a new wave of DTC brand discovery marketplaces like The Fascination, Thingtesting, or Etsy. Neither could it replicate social features and user-generated content of Instagram or TikTok. Finally, it’s unclear whether brands would benefit from it or instead see their products buried in search results.
Amazon Aggregators
Amazon aggregators - firms that acquire successful Amazon third-party sellers - raised over $12 billion in 2021. The amount raised includes both equity and debt financing. Forty-five Amazon aggregators announced funding rounds, of which 29 raised at least $100 million. More than 40 other firms didn’t disclose funding rounds but were otherwise active. For comparison, the total amount raised in 2020 by the few active aggregators at the time was only around $1 billion.
The top five aggregators - Thrasio, Berlin Brands Group, Perch, Heyday, and SellerX - raised over $7 billion (nearly half of that was by Thrasio alone). Of the total capital raised, they accounted for 55%. The forty smaller aggregators were responsible for the other 45%.
There were aggregators in 20 different countries. Most aggregators were from the United States. Nevertheless, there were also companies operating in Belgium, Canada, China, Finland, France, Germany, India, Israel, Japan, Luxembourg, Mexico, Portugal, Singapore, Spain, Switzerland, The Netherlands, Turkey, UAE, and United Kingdom. However, the headquarters location is not particularly significant - aggregators were buying businesses from all over the world, practically all of which sell on Amazon in the U.S. But some firms were trying to differentiate by focusing on local marketplaces or building unique access to local seller communities.
| Company | Headquarters | Capital Raised |
|---|---|---|
| Thrasio | Walpole, MA | $3.4 billion |
| Berlin Brands Group | Berlin, Germany | $1.3 billion |
| Perch | Boston, MA | $908 million |
| Heyday | San Francisco, CA | $800 million |
| SellerX | Berlin, Germany | $767 million |
| Razor Group | Berlin, Germany | $572 million |
| Merama | Mexico City, Mexico | $445 million |
| Benitago Group | New York, NY | $380 million |
| Boosted Commerce | Los Angeles, CA | $380 million |
| Elevate Brands | New York, NY | $372 million |
| Unybrands | Miami, FL | $325 million |
| Heroes | London, United Kingdom | $265 million |
| Mensa Brands | Bangalore, India | $218 million |
| factory14 | Luxembourg | $200 million |
| Growve | St. Petersburg, FL | $175 million |
| Accel Club | Amsterdam, The Netherlands | $170 million |
| Olsam Group | London, United Kingdom | $165 million |
| Acquco | New York, NY | $160 million |
| Moonshot Brands | Oakland, CA | $160 million |
| Nebula Brands | Beijing, China | $156 million |
| Branded | Paris, France | $150 million |
| Cap Hill Brands | Seattle, WA | $150 million |
| Global Bees | New Delhi, India | $150 million |
| Suma Brands | Minneapolis, MN | $150 million |
| Forum Brands | New York, NY | $127 million |
| D1 Brands | New York, NY | $123 million |
| Intrinsic | New York, NY | $115 million |
| Foundry | Austin, TX | $100 million |
| The Stryze Group | Berlin, Germany | $100 million |
| Dwarfs | Amsterdam, The Netherlands | $80 million |
| Valoreo | Mexico City, Mexico | $80 million |
| Opontia | Dubai, UAE | $62 million |
| Rainforest | Singapore | $56 million |
| Gravitiq | London, United Kingdom | $55 million |
| Una Brands | Singapore | $55 million |
| Profound Commerce | Austin, TX | $53 million |
| UpScalio | Gurgaon, India | $42 million |
| 10club | Bangalore, India | $40 million |
| G.O.A.T Brand Labs | Bangalore, India | $36 million |
| TCM Digital | Herzliya, Israel | $28 million |
| Quinio | Mexico City, Mexico | $20 million |
| Wonder Brands | Mexico City, Mexico | $20 million |
| Forest | Tokyo, Japan | $8 million |
| Markai | San Francisco, CA | $4 million |
| Telos Brands | San Francisco, CA | $2 million |
Amazon seller valuations had doubled since the start of 2020, in part because of the growing Amazon aggregator presence. Amazon aggregators were the most active buyers acquiring Amazon sellers - they made a few hundred acquisitions in 2021. There were only a few buyers in 2020, and the concept of selling an Amazon seller business seemed far-fetched. Sellers were heavily undervalued, and in 2021, the market was catching up.
By the end of 2021, Amazon private label sellers were getting acquired for SDE/Adjusted EBDITA multiples of 4x - 8x, plus an earn-out that sometimes brought the total valuation north of 10x. At the start of 2020, average valuations started at 2.5x - 3x. Amazon sellers typically get acquired for multiples of Seller’s Discretionary Earnings (SDE), which is a sort of an Adjusted EBDITA or annual net profit in rough terms, including add-backs of certain expenses.
The above multiples are surface-level benchmarks of the market, however. Valuations were not calculated by simply multiplying the SDE by a pre-set multiple. Deal structures were complex, and buyers did not value all businesses equally. The product category, the total profit, growth trend, expansion opportunities, and competitive position were significant differentiating factors for valuation. There were additional considerations for how much is paid upfront versus how big the earn-out or the stability payment is.
Previously, many sellers could be quickly acquired for low multiples, with small competition among buyers, and grown with basic Amazon optimizations to pay back the investment. Because of higher acquisition prices, buyers need to do more to have a positive ROI, and it will take longer to achieve it. Higher valuations also mean mistakes will be expensive than before. To understand the companies they were acquiring, buyers were more cautious and invested in better due diligence. Because of that, acquisitions were taking longer. And the global supply chain issues were also making some of the agreed deals fall apart.
For those building brand holding companies, the multiples paid were inconsequential - they are betting on being able to build a portfolio that will be orders of magnitude more valuable in the future. For others looking at this from the private equity multiple expansion point-of-view, rising multiples were a concern: a roll-up of dozens of businesses acquired for 2x - 3x is significantly different from the current 4x - 8x multiples - especially given the prevailing headwinds affecting e-commerce, like the disruption to global supply chains. It was briefly a private equity play but is undoubtedly an e-commerce and supply chain challenge. Operational skills matter a lot more than M&A experience.
Amazon Advertising
Advertising on Amazon reached $1.33 price per click by the end of 2021. Up 43% from $0.93 at the start of the year and up over 37% year-over-year from 2020. Demand for advertising on Amazon was rising faster than the ad inventory on and off Amazon (it hasn’t increased the number of ads in search results for a while), thus driving up advertising prices. Advertising prices have changed nearly identically across all Amazon markets, not just the U.S. Established brands and Amazon aggregators were bringing their advertising budgets to Amazon. As a result, they could afford to compete for ad space despite rising prices, only to increase them further. The same happened on Google and Facebook, two leading ad platforms, in the past.
The average Amazon cost-per-click (CPC) was $1.13 in 2021 compared to $0.85 in 2020. It reached the lowest point of $0.70 in early May 2020 when the pandemic caused supply chain disruptions, resulting in some brands running out of stock and pulling back on advertising. However, it recovered by mid-September 2020 and then hit three distinctive peaks: Prime Day in October 2020, Black Friday and Cyber Monday in November 2020, and holiday shopping in December 2020. After that, CPC settled at around $0.90 for most of Q1 2021 before hitting new peaks during Prime Day in June 2021 and holiday shopping in December 2021.
The average advertising cost of sale (ACoS) was 22% in 2020. ACoS is the total ad spend divided by the total ad sales. At the start of 2021, it was 25% and rose to over 30%. Yet, the average conversion rate - the percentage of clicks an ad converts into sales - remained relatively stable at 12%-13%. Thus the average Cost of Sale was $6-$7 in 2020 but rose to $9-$10 in 2021 - it took eight clicks at an average price of $1.20 to generate one sale, up from $0.85.
Advertising adds to the customer acquisition costs (CAC). Before advertising gained prominence, CAC on Amazon was typically 15% - the transaction fee it charges for each sale (because of the nature of Amazon, brands usually pay a CAC price for each order, rather than recouping it over 2nd and further orders). However, advertising pushed customer acquisition costs significantly above 20%.
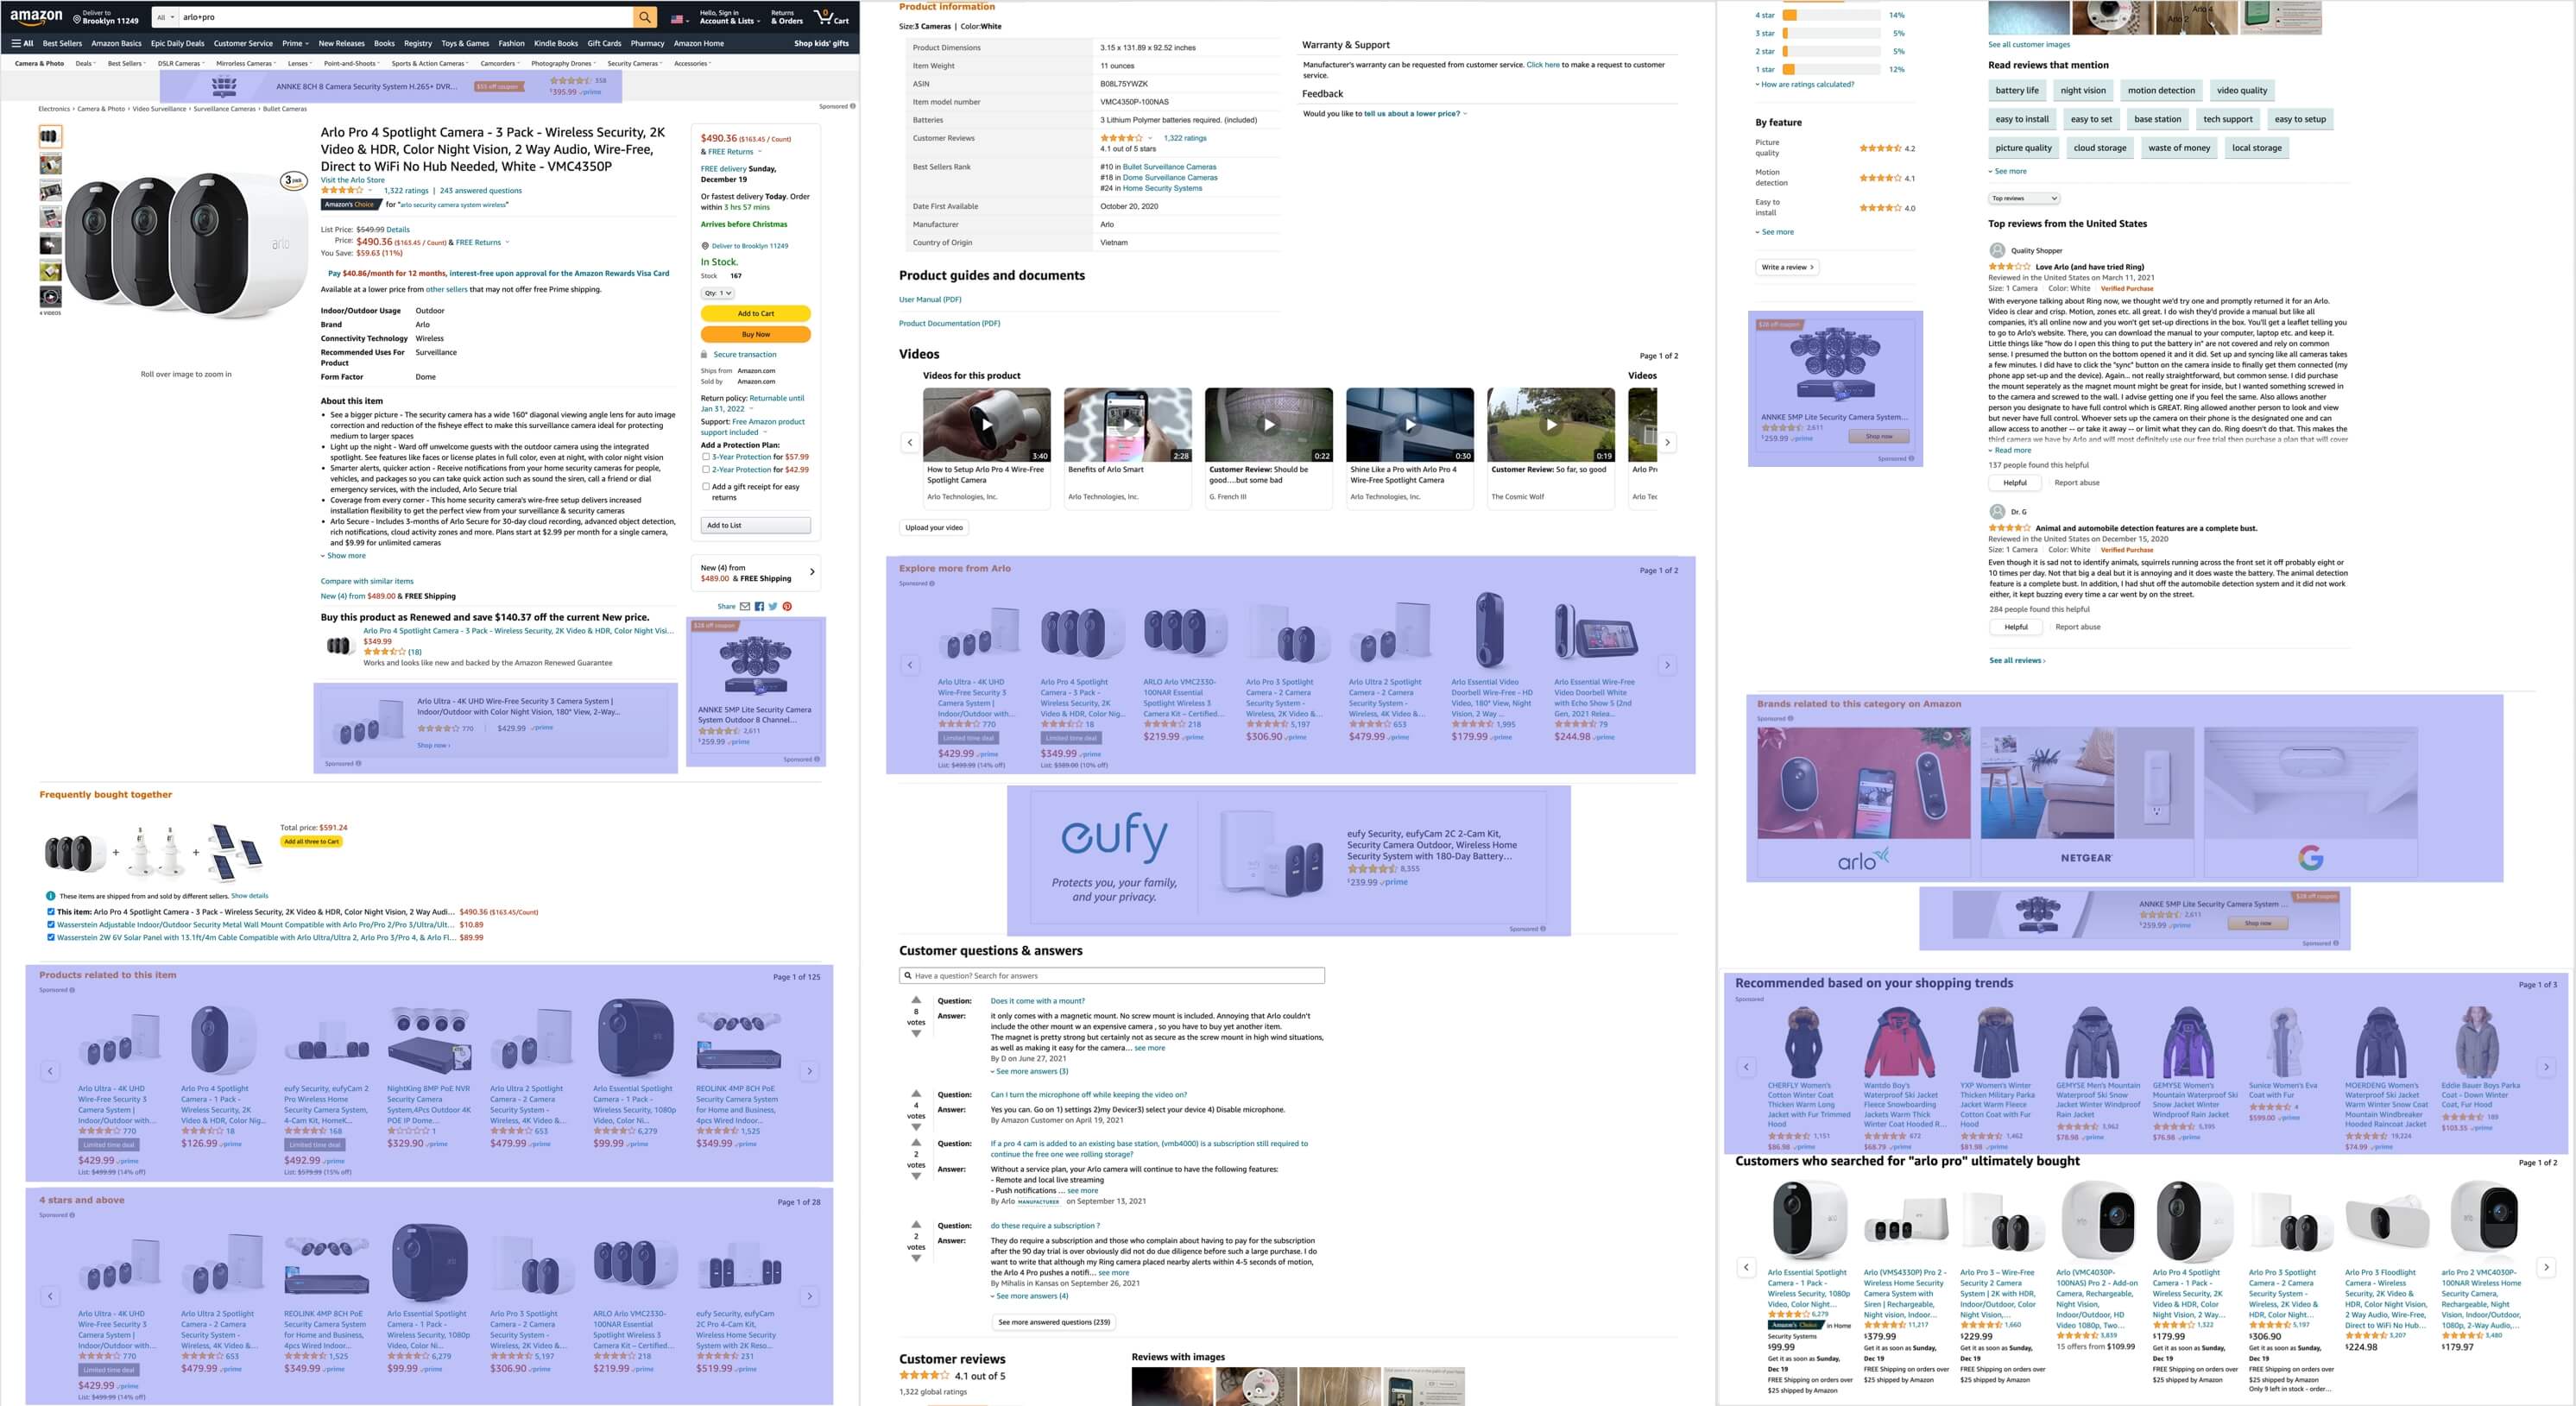
Advertising has replaced product recommendations and personalization on Amazon. They were no longer trying to guide product discovery, letting ads instead lead the journey. “Sponsored products related to this item,” “Four stars and above,” and “Brands related to this category on Amazon” advertising sections have all but replaced organic “Customers who bought this item also bought” and “Customers who viewed this item also viewed” suggestions. The last remaining recommendation functionality was “Frequently bought together.” Everything else on the product page, including additional display advertising, was an ad.
Other retailers were copying Amazon; eBay, for example, also replaced product recommendations with ads. Walmart, too, aimed “to grow this [advertising] business to become one of the top 10 advertising platforms in the U.S. over the next few years,” Walmart Chief Customer Officer Janey Whiteside said in an interview with CNBC. The reason is apparent when comparing Amazon’s net income (profit) to advertising revenue. Advertising revenue is nearly all profit, so its growth identically matches Amazon’s profitability growth. Other retailers want to replicate that.
Seen on Netflix, Sold on Amazon
Amazon is the default search engine for many shoppers. When they see something they like in a Netflix show or elsewhere on social media apps like Instagram or TikTok, they go to Amazon to find it. Amazon’s infinite catalog helps here. Amazon captures that demand without having to pay for advertising or affiliate fees.
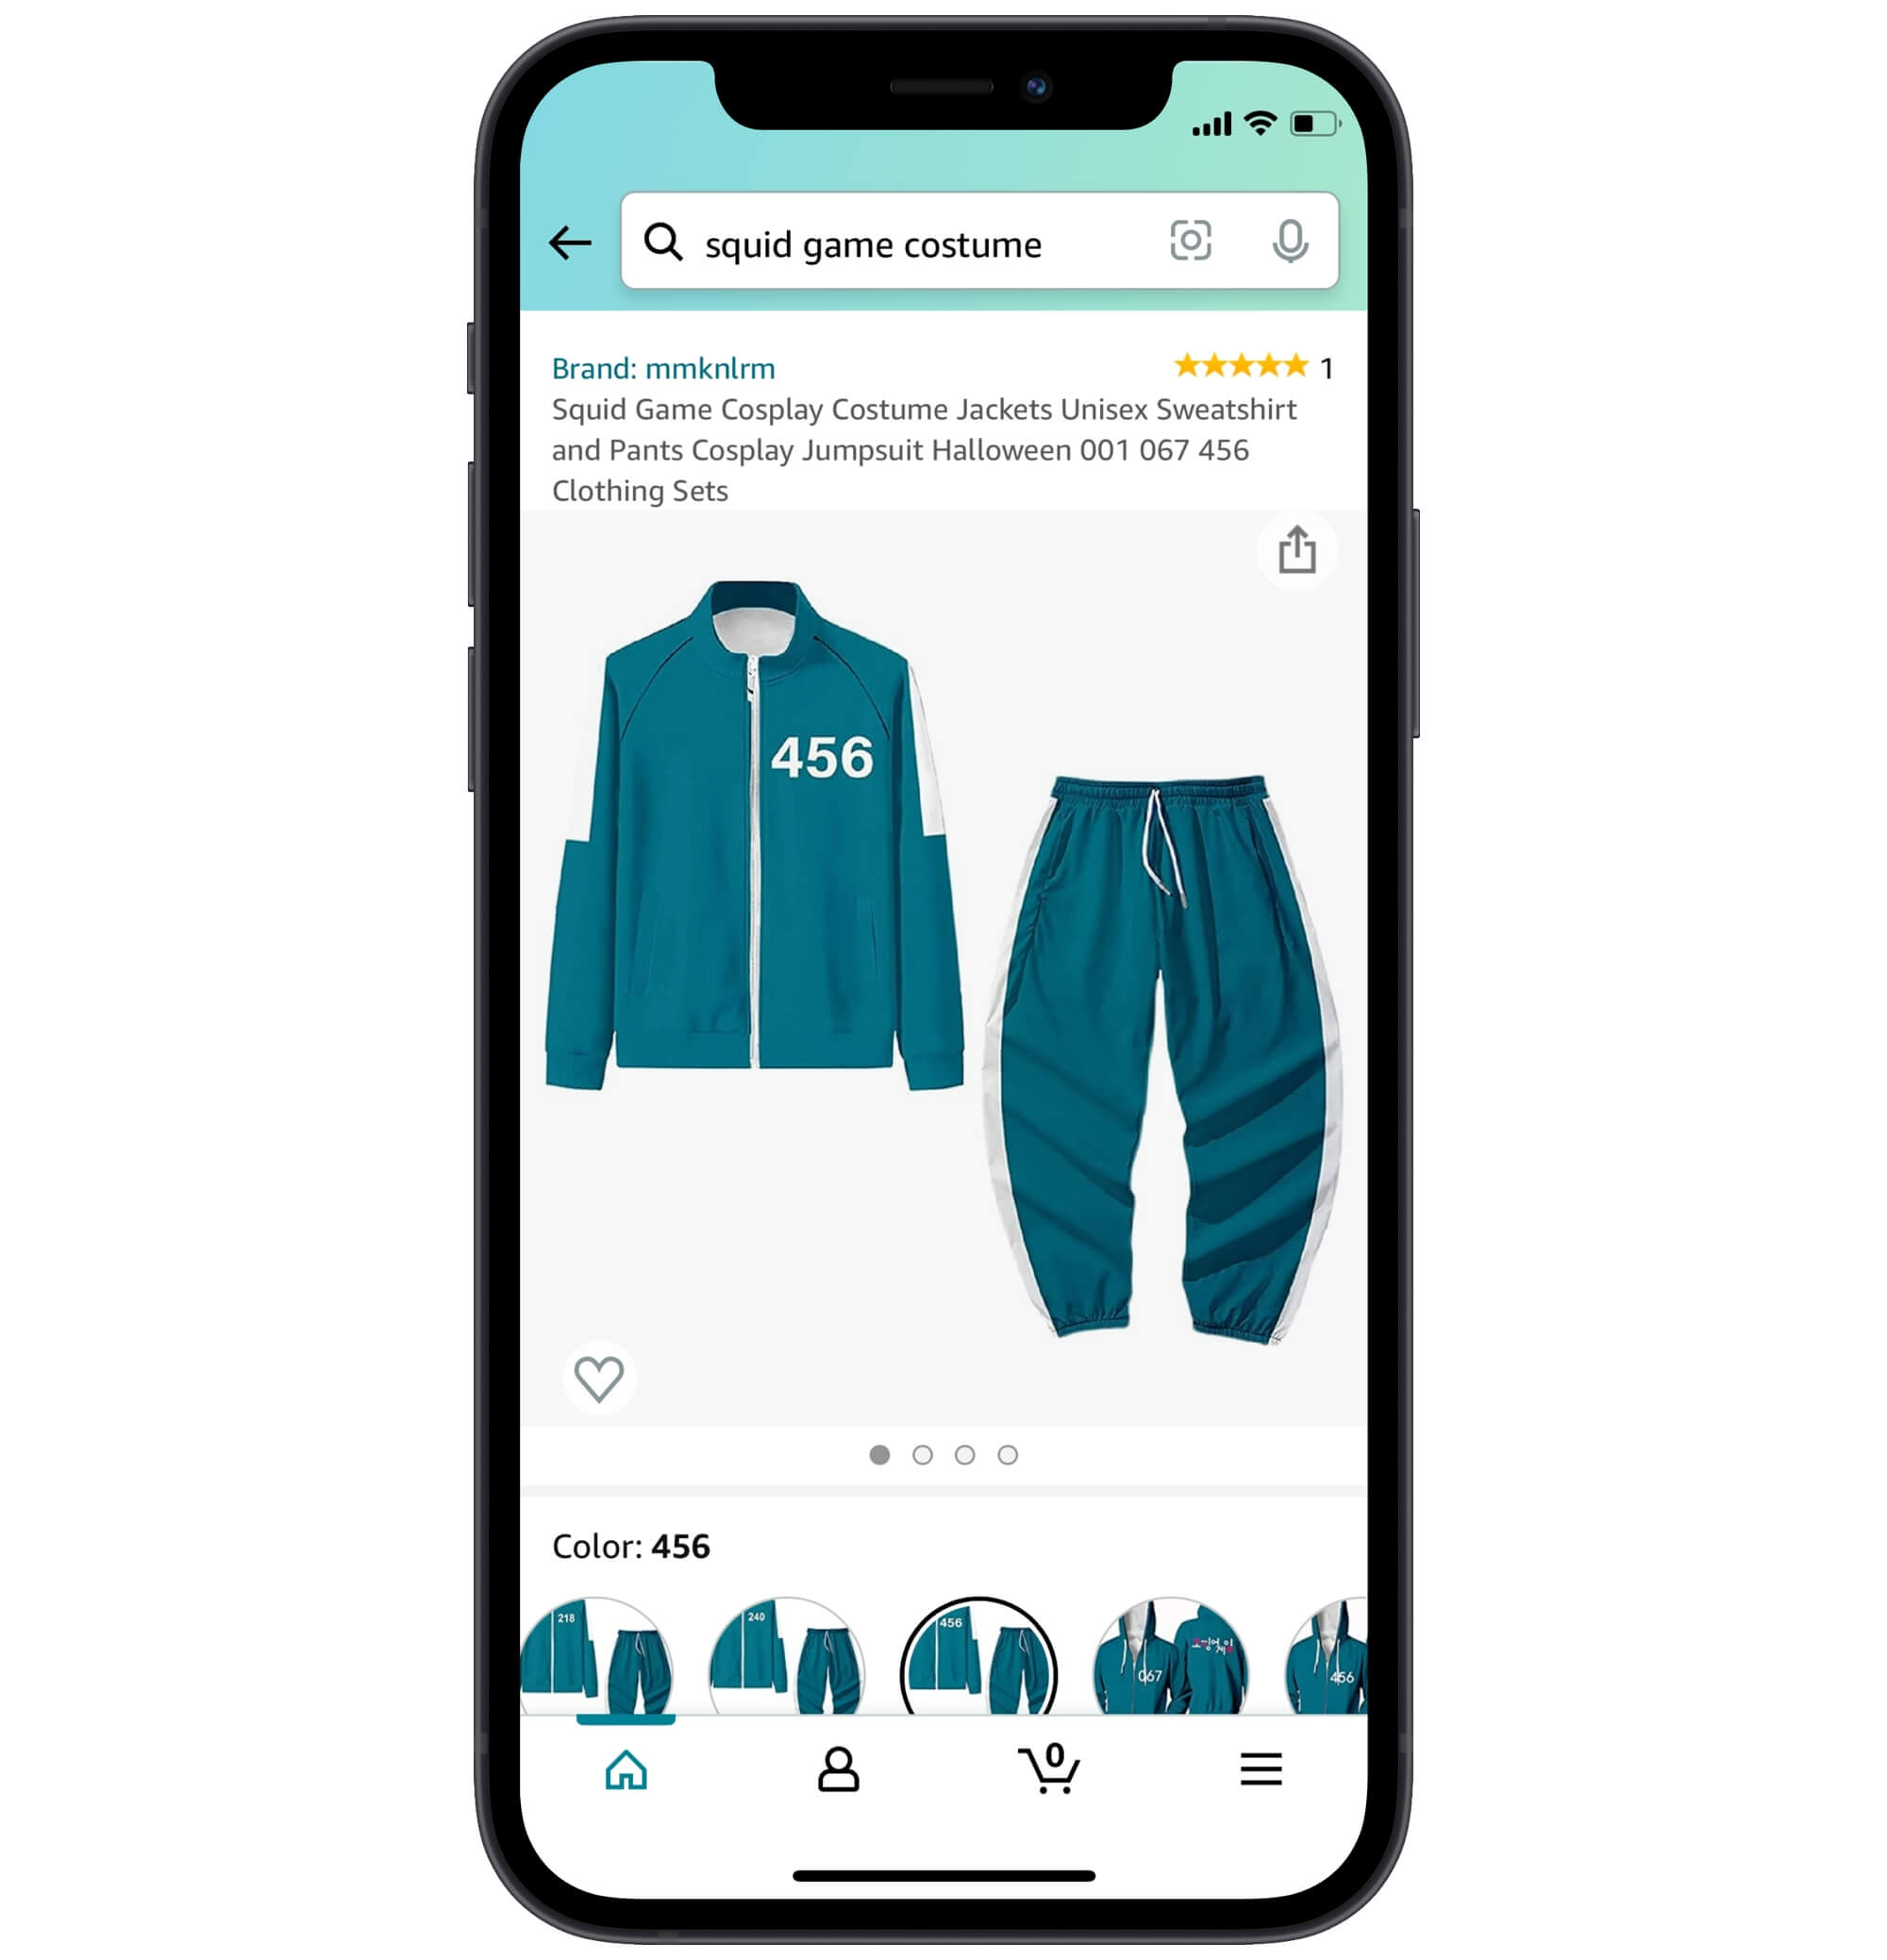
In October, the #1 most-searched term on Amazon was “squid game costume.” Netflix’s hit dystopian thriller “Squid Game” spawned a craze for Squid Game costumes less than two weeks after the show was released. There was no official show merchandise, however. Amazon had products on offer because its marketplace is typically the fastest to respond to changing trends. A few hundred sellers were actively selling improvised merchandise - particularly the tracksuits.
Other retailers had nothing in stock; thus, Amazon likely captured most Squid Game-related merchandise sales. Netflix’s merchandise strategy was lacking - in June, it launched a merchandise website Netflix.shop, but it didn’t promote it and did not integrate it into the Netflix TV app. In October, Walmart announced that it launched the Netflix Hub at Walmart.com/netflix, which it said would be the “biggest online retail destination for Netflix consumer products in the U.S.” That destination instead was still Amazon.
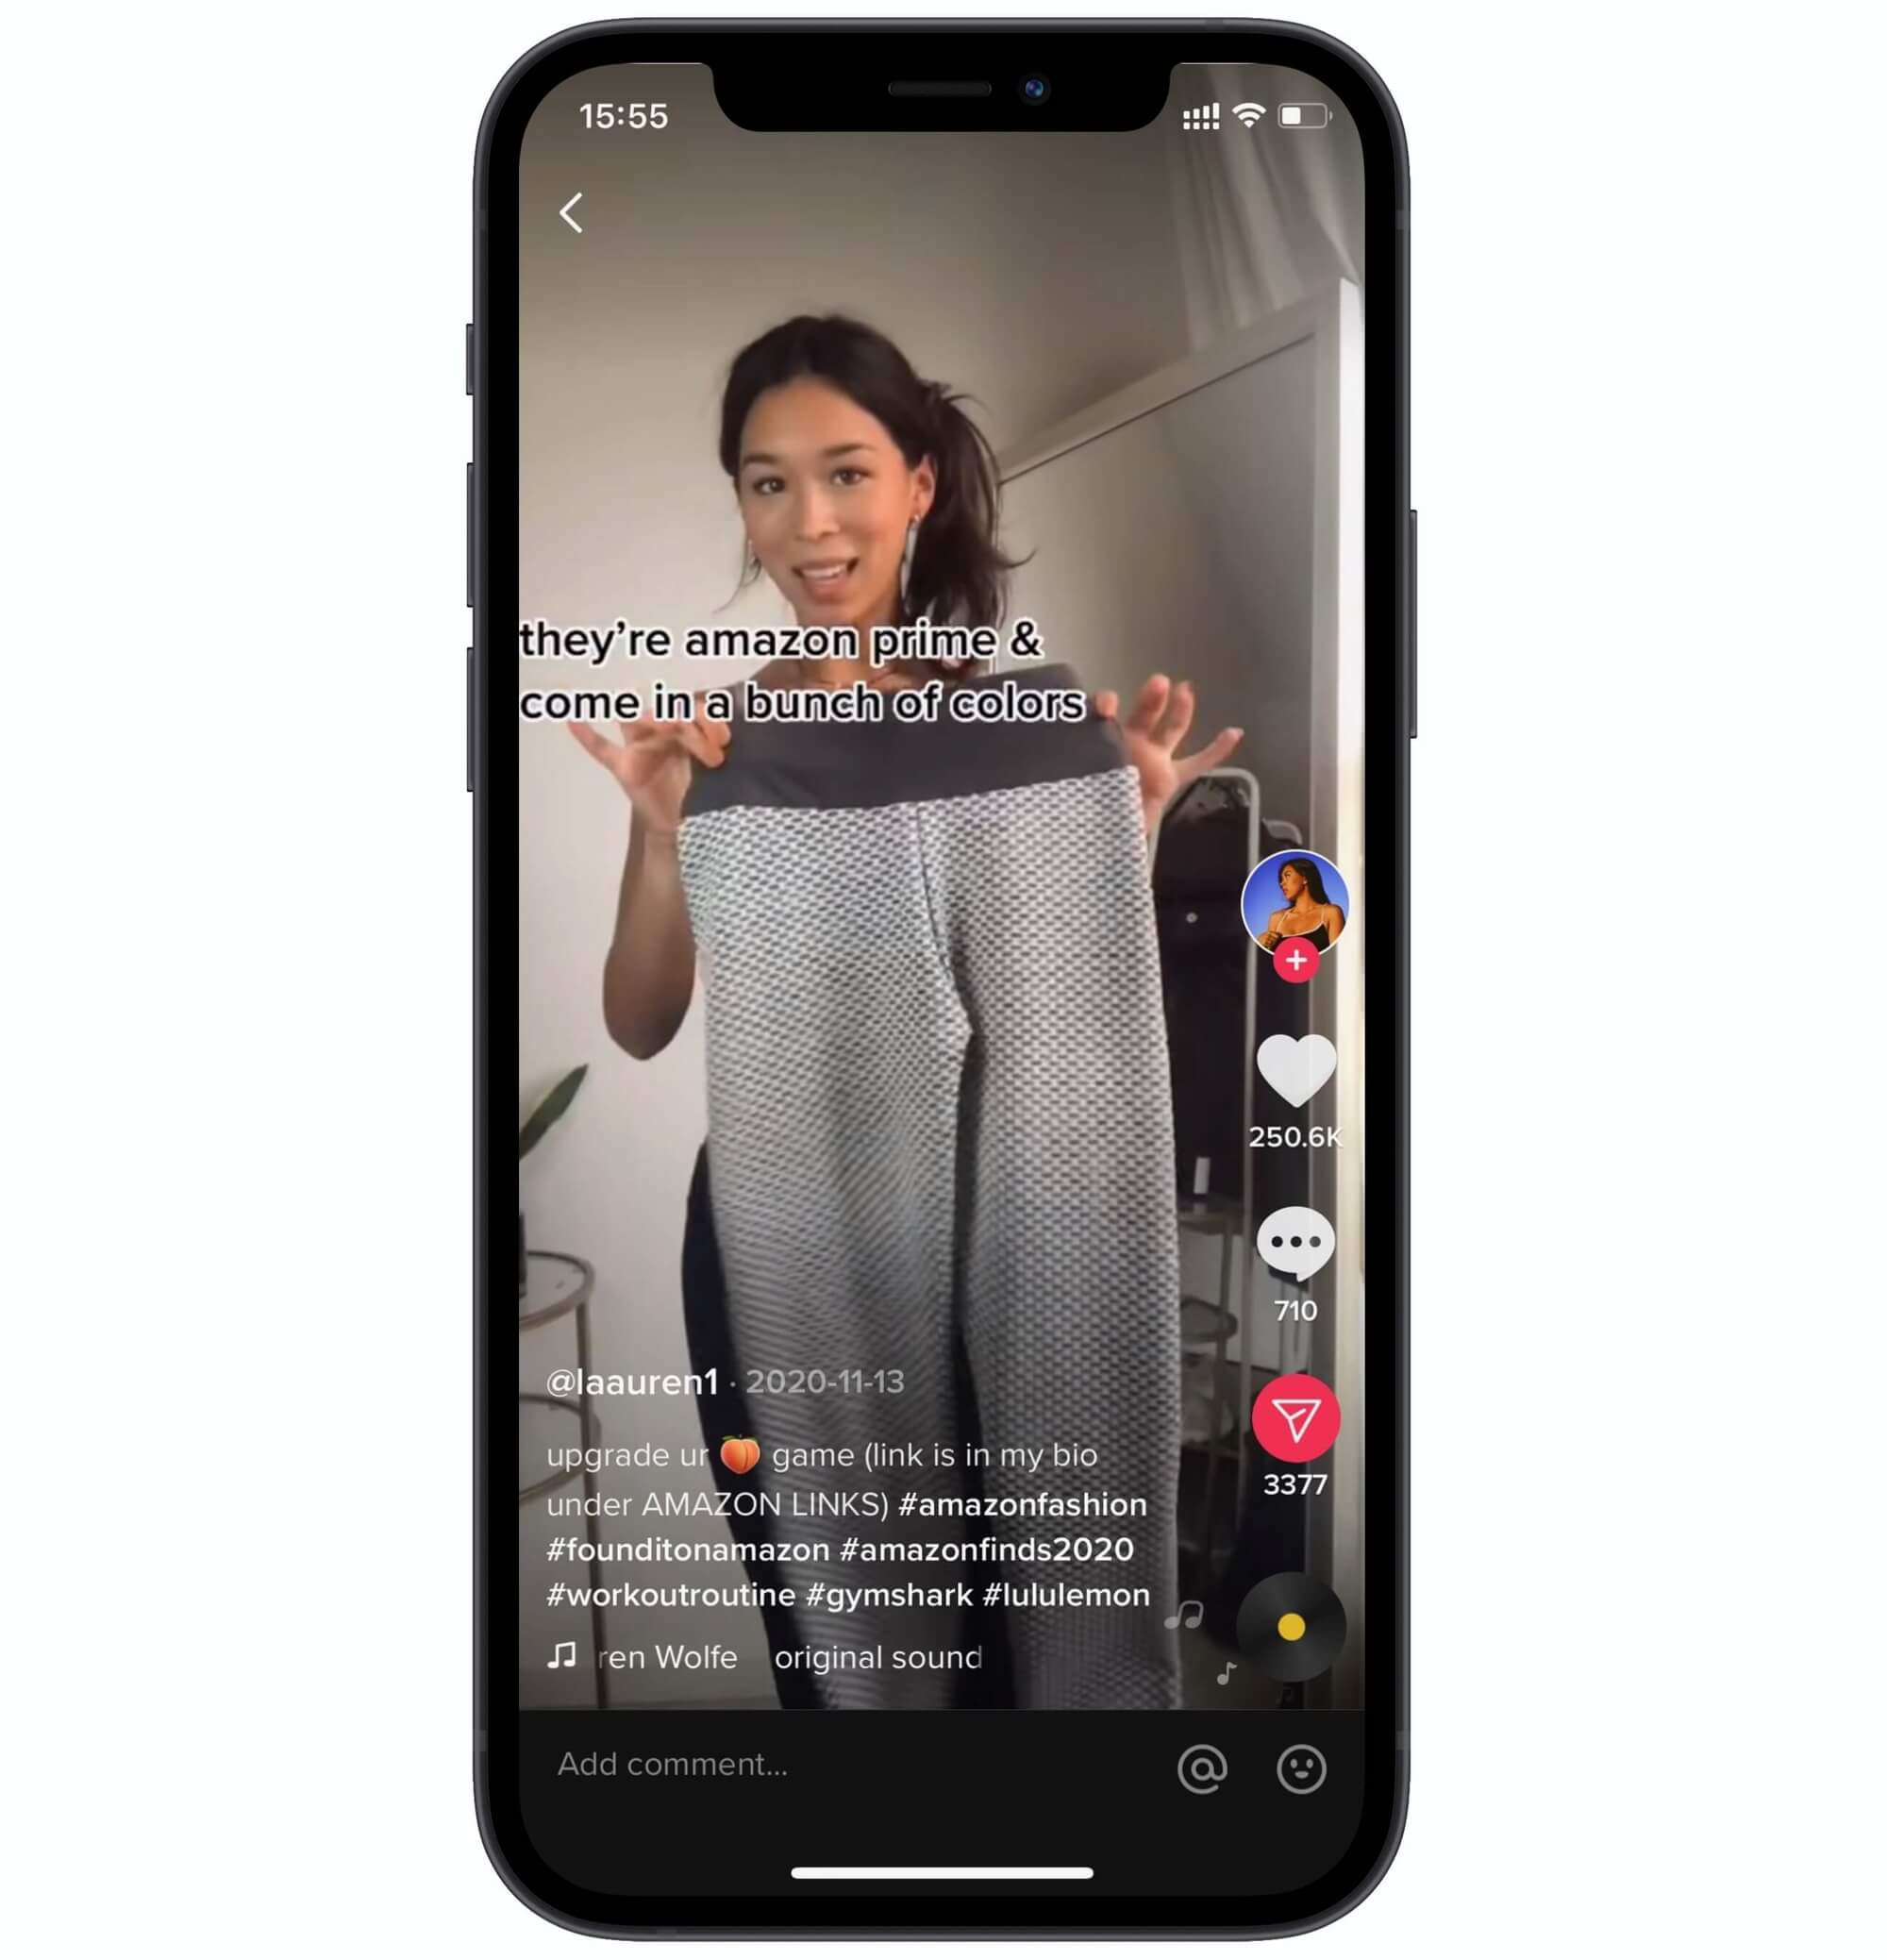
The #1 best-selling clothing product on Amazon for most of January and February was a pair of high waist leggings that went viral on the social app TikTok. The trend didn’t disappear even twelve months later. Shoppers were looking for them by searching for “tiktok leggings.”
The trend started in November 2020 when Lauren Wolfe posted the first video. By the end of 2021, that video had more than 2.6 million views on TikTok. While the hashtag #tiktokleggings had 745 million views, and #amazonleggings had 248 million. Due to TikTok’s limitations, none of the videos shared by its users could link to the specific product. Instead, users searched for the product on Amazon after seeing a video on TikTok.
Social commerce is in its infancy in the U.S., but it was indirectly driving sales already. The hashtag #amazon had twenty billion views on TikTok, and other related categories had even more. Many users went shopping on Amazon after seeing one of those videos. That happened without Amazon directly buying ads on TikTok and without the videos linking directly to any products. TikTok, Instagram, and Facebook introduced many social commerce features. But their role in commerce still primarily revolved around advertising and being discovery platforms - minimal transaction volume happened in-app.
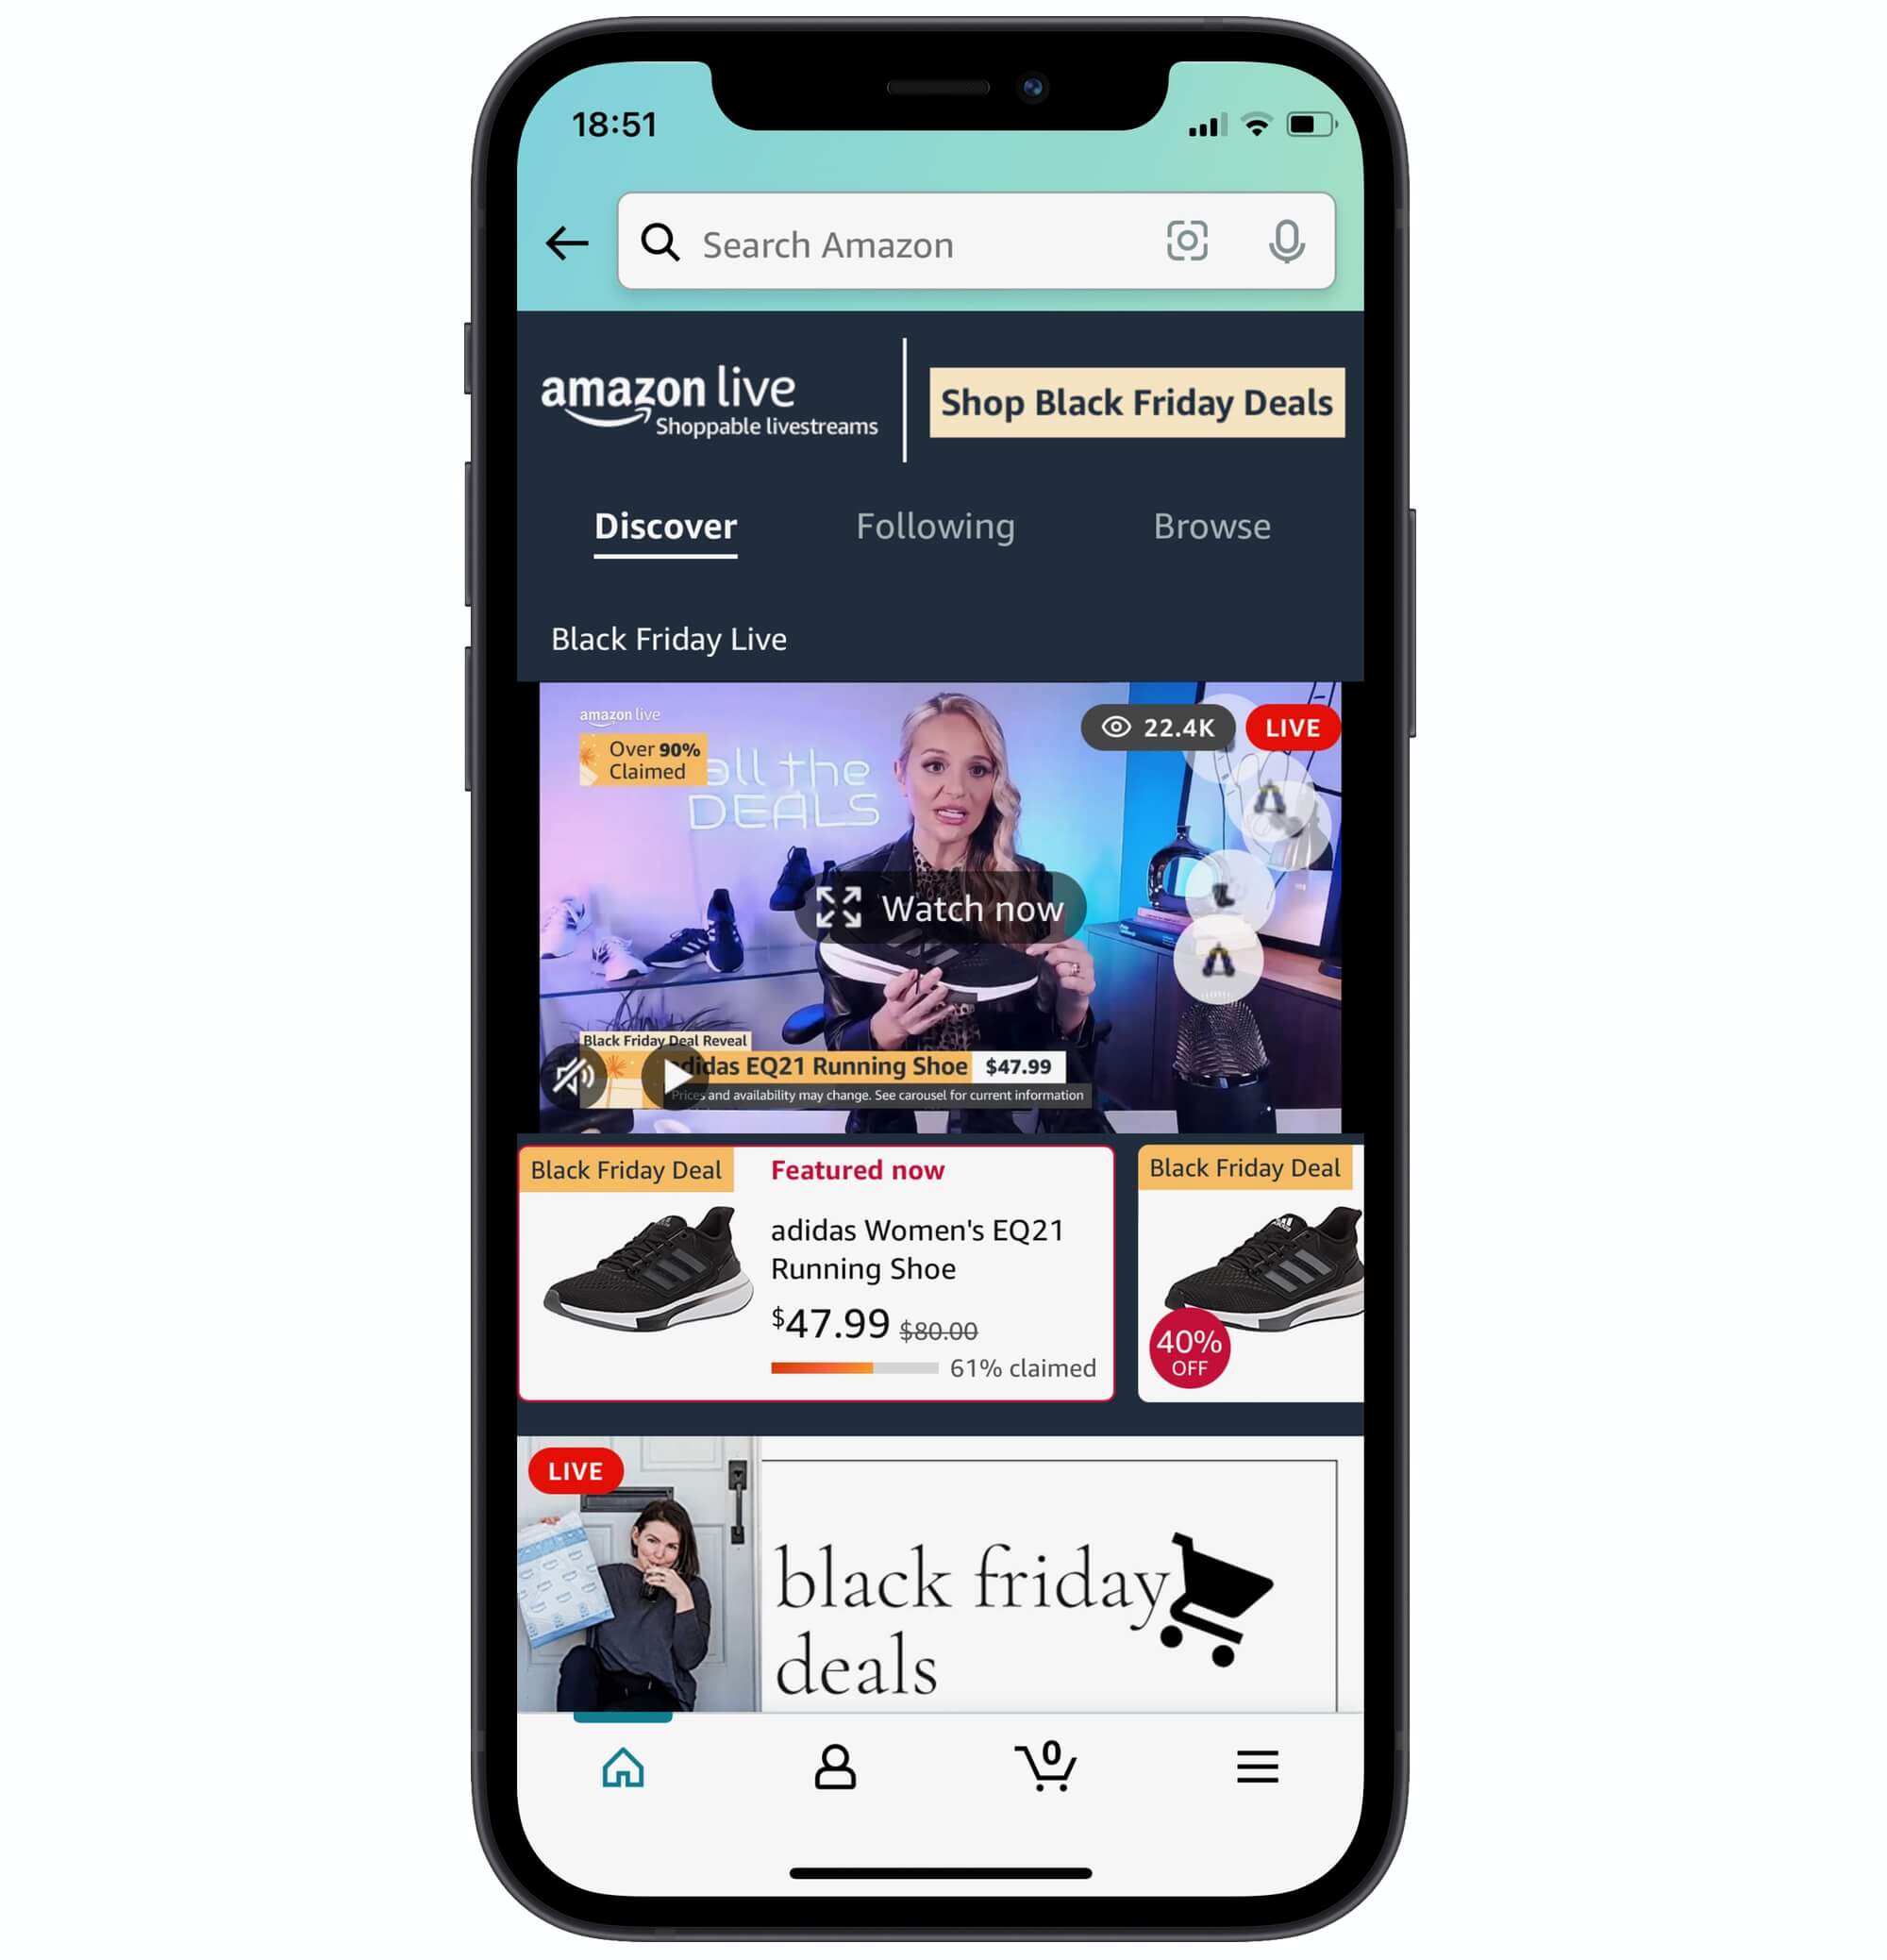
Meanwhile, Amazon’s attempts at interactive commerce continued to be underwhelming. During Prime Day and Black Friday/Cyber Monday events, its live streams attracted tens of thousands of viewers, but the number is not impressive given how many people shopped during those events. Amazon used the same template for the events as in the past years, falling back to a grid of deals with some basic filters. The accomodating video streams did not appear to be a key investment area.
Amazon has outsourced product discovery to external platforms. During Prime Day, for example, news sites covering the event offered up lists of best deals to shoppers because without that, many wouldn’t know how to find them. Social networks like Instagram and TikTok are doing that through users boosting each other’s posts. Personalization and recommendations are no longer part of the core Amazon experience.
Amazon is the Default Search Engine
Two years ago, Nike stopped selling its clothes and sneakers directly to Amazon. The brand has since done exceptionally well scaling its digital sales. And yet, consumers continued to look for Nike on Amazon. Nike products were among the top 10 most-searched brands on Amazon for years. The brand’s popularity on Amazon didn’t materially change when Nike stopped selling to Amazon. The only brands that attracted more attention were Apple, Nintendo, Lego, PlayStation, Crocs, Anker, Uggs, Xbox, and Funko Pop.
Searches related to Nike products continued to be among the top 200 most-searched keywords - before and after Nike’s decision. Decisions by neither Nike nor Amazon did not appear to have any influence. The only time Nike fell out of the top 200 was in March and April 2020, when product searches for essentials like face masks replaced it.
More people shopped directly from Nike than search for its products on Amazon. Nike is doing great. But it is also one of the most recognized consumer brands. The point is not about Nike - it is that customers go to Amazon despite brands’ best efforts to reach them directly - in all ways that matter, shopping on Nike.com is better for the customer. If some Nike customers defaulted to Amazon, even more defaulted for other brands. That makes Amazon the default search engine of commerce. The number of people who check on Amazon before looking elsewhere is perhaps its deepest moat. In the case of Nike, some noticed that choices were limited and went looking elsewhere. But quite often, the products offered were what the customer was searching for.
Amazon Sellers
An increasing percentage of sales on the Amazon marketplace comes from sellers that have been on it for years. More than half, from those who joined in 2017 or earlier. Despite the continuous inflow of new sellers that were still joining at the rate of thousands a day. At the same time, new sellers were finding opportunities and bringing incremental marketplace growth.
New sellers were adding additive volume to the existing base. Meanwhile, some of the old sellers churn (because they stopped selling, got suspended, or had other reasons). The data shows that sellers were churning slower than new sellers were joining. The expanding overall marketplace GMV allowed new sellers to grow without taking away sales from the existing sellers. Amazon marketplace is, thus, not saturated.
Amazon’s cohort data shows that the marketplace is not saturated, sellers have been successful for years, churn is stable, and new sellers find opportunities. Amazon’s cohort analysis is total volume, month by month, broken down by seller’s first year on the marketplace and represented as a share of the total. If the top right-most layer in the chart (representing newest sellers) were to look significantly different, it would indicate marketplace health issues. It visually represents the balance of sustainability and competition. The marketplace would be saturated if the layer was drastically smaller than during previous years at the same time. Established sellers would be churning faster if bigger than in earlier years.
The largest group in the top sellers’ list are businesses that joined Amazon over five years ago - 56% have been selling since 2016 or earlier. Only 8% are sellers that joined over the past two years. This data reinforces the long-term sustainability of businesses relying on the Amazon marketplace.
Top sellers typically remain so for multiple years. For example, 40-45% of the top 10,000 sellers continued to be active sellers through their third year on Amazon. 50-55% of top sellers continued to be in the top two years later, and 60-65% stayed in the list after one year. These percentages held for the top sellers from 2015, 2016, 2017, 2018, 2019, and 2020. The early indication is that later cohorts were doing better too.
Sellers that built brands dominated the top sellers’ list. Only 12% of the top sellers had more than 1,000 products for sale. Five years ago, in 2016, that number was 33% - the share has steadily decreased since then. Amazon conceived the marketplace to bring brands it couldn’t convince to sell onto the site. For years, most of the sellers were large resellers with tens of thousands of products. However, increased competition and brands going direct has eroded that opportunity. There were still successful resellers left and new sellers starting with this business model. The trend has also stopped progressing in 2021. But the market had moved on - private label sellers took their place.
Revolving Door of Brands
In many categories, the list of best-sellers on Amazon was different day-to-day. And it was not new trends replacing old ones. Instead, brands that didn’t exist just recently were pushing out other short-lived brands. Unrecognizable, unpronounceable, and unmemorable and only created for the sake of selling on Amazon. For example, in the headphones category, 1,800 unique products from 666 brands were among the top 100 best-sellers in the last twenty-four months. That’s nearly three new products from almost one new brand every day replacing the current items in the list. Those brands were pseudo-brands like NUBBYO, LAFITEAR, NANMING, AIWONS, or HWCONA.
Only five brands - Apple, Samsung, Sony, Soundcore, and Tozo - had a product in the headphones best-sellers list for the entire twenty-four months. Just twenty were in it for over 500 days (70% of the time). More than half of brands were on the list for only five days or less; hundreds of brands gained some momentum, all to lose it among the sea of lookalikes a few days later. Many categories exhibit this behavior. Furthermore, there didn’t appear to be a slow down in the share of the list that got constantly replaced. Top brands retained their positions, but new entrants entered the best-sellers list daily. Brand moats on Amazon, then, were rare but not necessarily impossible.
So many brands were launching on Amazon that their trademark registrations were overwhelming the U.S. Patent and Trademark Office (USPTO). “As of June 17th, the increase [in trademark applications] is roughly 63% over last year, which translates to about 211,000 more applications,” the office wrote in a blog post. “And in December 2020 alone, the USPTO received 92,608 trademark applications, an increase of 172% over December 2019.” In July 2021, the backlog of pending trademarks at the USPTO surpassed 900,000 for the first time. The brand name is not critical for those brands (many appear like a randomly generated string of letters). And the only reason they go through the USPTO registration is that trademarks unlock the Brand Registry service on Amazon, among other benefits.
Best-sellers had tens of thousands - or, sometimes, hundreds of thousands - of reviews. That meant new entrants had to do more to compete against what appeared universally-liked products. Popular products on Amazon have significantly increased the number of reviews since the company introduced one-tap ratings in October 2019. For example, among the headphones category best-sellers, the average increased from 4,500 in 2019 to 25,000 in 2020 and over 40,000 in 2021. At the same time, the average rating rose from 4.1 to 4.4 out of 5.
Chinese Sellers
Amazon suspended hundreds of top Chinese sellers for participating in fake review schemes over April and May. Mpow and Aukey were the first major suspended sellers at the end of April; Amazon suspended nearly 300 seller accounts in total. The list of brands included Mpow, Aukey, VicTsing, Tacklife, Austor, Vtin, Seneo, Homasy, Homitt, LITOM, TopElek, OMORC, TRODEEM, Atmoko, HOMTECH, OKMEE, Fairywill, and others. Collective yearly sales of the suspended sellers exceeded $1 billion and included dozens of previously best-selling items. Even if the list of brands looks unrecognizable and, at points, randomly generated.
The suspension wasn’t temporary or accidental and focused on a few biggest brands. Unlike most Amazon suspensions, these got noticed by consumers, too. Fairywill’s powered toothbrush, for example, was among the top 5 five best-sellers on Amazon for at least three years. It had amassed over 75,000 reviews with an overall 4.5 out of 5-star rating. It had more reviews and routinely out-sold more expensive competitors from established brands like Philips and Oral-B. Fairywill is one of the suspended brands. The Fairywill toothbrush was named one of the “13 Best Electronic Toothbrushes of 2021” by GQ and featured by hundreds of other publications. The GQ article referenced reviews on Amazon and quoted one of them (the same reviews that got the brand suspended).
“Made in China, sold on Amazon” is a big part of the Amazon marketplace. The suspensions did not impact that dynamic significantly - the suspended sellers represent a tiny share of the total number of China-based businesses on Amazon. Nonetheless, the stories of Mpow, Aukey, VicTsing, Taotronics, RavPower, Fairywill, and many others sent shockwaves through the Chinese seller communities. A few of the suspended sellers announced layoffs and bankruptcies.
The suspended brands were decent products and, at the same time, relied on illegal tactics to get ahead of the competition. They didn’t outwit the Amazon system to peddle worse products. They manipulated the system because they likely felt that if they didn’t, others will. Amazon’s ineffective oversight of the marketplace enabled this. And it worked; for many years. Wirecutter of The New York Times recommended Mpow, CNET suggested RavPower, and GQ liked Fairywill. And then they were gone from Amazon.
Chinese sellers were losing market share on the Amazon marketplace for most of 2021. After increasing market share for years, the trend had unexpectedly reversed - 2021 was an anomaly compared to the five years preceding it. Previously, Chinese sellers’ market share of the top sellers increased every year: from 16% to 22% in 2017, from 23% to 26% in 2018, from 26% to 33% in 2019, and from 35% to 42% in 2020.
At the end of 2021, 33% of the top sellers were China-based. Down from 40% at the start of the year and nearly down from January 2020. The figure is the average of the four core Amazon markets - U.S., U.K., Germany, and Japan - derived from an analysis of over 90% of the top sellers whose business addresses could be reliably determined. Out of those four marketplaces, it shrank the most on Amazon in the U.S., while the other three were flat for most of the year and only started to decrease at the end of the year.
Last year, in May 2020, Chinese sellers’ market share shrunk because of disruption to manufacturing, freight, and warehousing. By the end of 2020, it had recovered. But, since then, it didn’t go back to growing as it did for years prior. Perhaps because the pandemic continued to disrupt the world unevenly or because domestic sellers could diversify from FBA faster than foreign sellers. Some of that lost market share was also because of the hundreds of suspended sellers.
Most of Amazon’s marketplace sales volume on its worldwide marketplaces came from first, domestic, and second, Chinese sellers. Other countries combined represented a small percentage. Domestic sellers amounted to less than half in France, Italy, Spain, Mexico, and Canada. The critical finding is the relatively small domestic presence and that cross-border selling on Amazon concentrates in a few countries. For example, there was little overlap between Europe and the U.S.: European sellers represented a small percentage of the U.S. volume, and few U.S. sellers were booming in Europe.
Meanwhile, Walmart opened its marketplace to international sellers in March and added more than 6,000 sellers from China. By the end of the year, they represent more than 20% of new sellers in a month. “Chinese sellers have very obvious advantages in the global cross-border e-commerce field,” said Michelle Mi, Vice President of Global Sourcing at Walmart, in a conference hosted in Shenzhen on March 25th, 2021.
Some new sellers were already using Walmart Fulfillment Services (WFS) for warehousing. WFS makes the seller’s business location practically invisible to shoppers since Walmart ships orders from domestic warehouses on the seller’s behalf. FBA played a crucial role in unlocking Amazon for international sellers, and the same was playing out on Walmart. Walmart was also the new home for some sellers suspended on Amazon earlier this year. Mpow, Aukey, Tacklife, and Ravpower, for example, opened storefronts on Walmart. The same Mpow headphones that used to come in two days from Amazon were available on Walmart with two-day shipping by Walmart.
Twenty Amazon Marketplaces
Amazon added two more markets - Egypt and Poland - to reach twenty global marketplaces. Amazon launched in Egypt on September 1st and in Poland on March 2nd.
The marketplace in Egypt followed Saudi Arabia and the United Arab Emirates in the region, where Amazon launched during the past two years. Egypt was Amazon’s smallest market to launch in yet. It competes with companies like the UAE’s Noom and Nigeria’s Jumia. Like in Saudi Arabia in June 2020 and the United Arab Emirates before that in May 2019, Amazon launched in Egypt by replacing the localized Souq.com store. It acquired the company in 2017 and has used the acquisition to establish itself in the region. Egypt was Souq.com’s last local operation left to transition to Amazon branding.
Poland launched with over seventy thousand sellers - Amazon’s largest launch yet enabled by Amazon’s existing infrastructure in Europe. Allegro is the market leader in Poland - its website attracts over 200 million monthly visits. With Poland added, Amazon operated in all of the top 10 biggest economies in Europe, except for Switzerland and Russia. It was their eighth in Europe (not counting Turkey, only half of which is in Europe), alongside the UK, Germany, France, Italy, Spain, Sweden, and The Netherlands. It launched in The Netherlands and Sweden in 2020.
Amazon.com in the U.S. remained the most important market, representing nearly 47% of total visits across its twenty worldwide marketplaces. The next three - Japan, Germany, and the U.K. - commanded roughly 10% each. The top five markets (U.S., Japan, Germany, U.K., and India) represented nearly 80% of web traffic. Newly launched marketplaces in Egypt and Poland, and those that came before, contributed little to growing the overall GMV.
Other Marketplaces
Walmart’s marketplace nearly doubled in size in twelve months to reach 130,000 third-party sellers. It added close to 5,000 new sellers monthly, significantly more than in previous years. However, much more importantly, WFS, a fulfillment service Walmart launched less than two years ago, already fulfilled 25% of Walmart’s marketplace sales, according to Brett Biggs, CFO at Walmart. Walmart was on a path to making the marketplace invisible to shoppers. Over 90% of items sold on Walmart online were by third-party sellers. Walmart was going through the same steps Amazon has taken to wrap that vast catalog in an experience it can control. That’s the role for WFS.
Target’s invite-only marketplace had only 440 sellers nearly three years since launch. Naturally, it was often the fastest-growing channel for those select few on it. Target continued to curate its selection: “On Target Plus, our approach continues to be the same. […] We’ll continue to make sure we curate very carefully and complement our store and online assortment,” said Brian Cornell, CEO at Target. The result of a curated marketplace is that a search for “wireless headphones” on Target returned 675 products, more than half of which were sold by Target. Walmart had just as many as a retailer but added 20,000 through the marketplace, and Amazon had millions.
Etsy added nearly three million sellers over the past twelve months to reach twelve million. At the start of 2020, it had less than seven million sellers. It also doubled the number of active sellers over the same period. The number of sellers joining the marketplace accelerated in April 2020 and remained elevated, continuing the growth spurt started by the pandemic. The United States, the United Kingdom, Canada, Germany, Australia, France, India, Turkey, Russia, and Spain were the most common countries of the newly joined sellers (in that order). That allowed Etsy to surpass 125 million products for sale; it had 60 million at the start of 2020.
eBay had 800,000 stores, plus millions more sellers that were selling casually. The vast majority of the top sellers on eBay had an eBay Store, which acts like a small website hosted on eBay and allows the seller to apply their branding. 30% of those sellers joined eBay over the past five years. And yet, 45% joined more than ten years ago. The United States, the United Kingdom, Germany, China, and Australia were the most common countries. The marketplace was adding new sellers, but most of its core were veteran sellers. However, the total number did not increase as sellers churned as fast as new ones joined.
Wish had more than 600,000 sellers, and it had accelerated adding sellers from other countries than the United States and China. In 2021, nearly 30% of new sellers were from other countries like Mexico, the United Kingdom, Brazil, Canada, Morocco, Italy, Sri Lanka, France, Vietnam, and Australia. However, 96% of the top most-active sellers (with at least 100 ratings) were still China-based. Thus despite the efforts to expand the seller universe, the app remained a direct-from-China marketplace.
The Future
Amazon is not going to bring innovation. Amazon’s first innovation was building the infinite catalog, which removed the need to shop elsewhere. Whatever the customers were looking for, Amazon had it (often, thanks to the marketplace). The second innovation was fast and convenient shipping and returns. Any products from that infinite shelf would show up in two days or less. That came in 2005 when it introduced Prime. Since then, it has announced hundreds of new offerings and experiments, but the core commerce experience remained virtually unchanged. Amazon learned it doesn’t need to do more.
Amazon found the things it needs to do to satisfy most shoppers most of the time more than a decade ago. The Wikipedia definition of a Minimum Viable Product, a term coined and popularized in Silicon Valley, is “a version of a product with just enough features to be usable by early customers who can then provide feedback for future product development.” Amazon gathered feedback that it didn’t need to do more than it already does. Both because it continues to grow and its competition is lagging. The Minimum Viable Amazon will continue to work for decades more.
Amazon has spent the last decade patching its empire. Catching fake reviews, dealing with counterfeits, solving fulfillment bottlenecks, and thousands more. Over that time, it built the largest catalog, fulfillment network, and employee base. Most of Amazon’s resources are devoted to keeping that running. Very little in trying to disrupt e-commerce. That’s why Amazon is not going to bring the future of shopping. Whatever it will end up being. It’s not going to figure out social commerce or live shopping. Amazon overtook Walmart in 2021, but it looks like an incumbent itself.
Shopping on Amazon requires effort. Every search page is an endless list of lookalike results, many of which are unrecognizable brands, and some are ads. Each product has thousands of reviews; some might be fake. It’s up to the shopper to research what to buy - Amazon doesn’t know what it is selling and can’t help. But that still works for many people. The over 200 million Prime members are the momentum that carries it.
E-commerce in the West looks practically the same as it did two decades ago. A search bar with a list of results. Amazon won that paradigm. It’s not going to get disrupted by anything that does the same thing. Any comparisons for “Amazon vs Walmart” or “Amazon vs Shopify” are trying to reverse time flow. Disruption will not look anything like Amazon, Walmart, or Shopify marketplace. And if it doesn’t come, Amazon will keep trudging along, adding $100 billion or more in GMV every year the disruption doesn’t come.
And yet, there are exciting areas to watch. Shein, a direct-from-China clothing shopping app, that, at one point in 2021, overtook Amazon for the #1 most-downloaded spot. Shopify, for example, but not necessarily for Shopify itself, but for the sort of business model and shopping model it represents. Instagram, TikTok, Facebook, Netflix, Pinterest, Snapchat, and their role in e-commerce. Fifteen-minute delivery apps. Niche marketplaces. Buy-Now-Pay-Later services that are growing up to be payment networks. The world of e-commerce doesn’t revolve around Amazon, even if we talk about them the most.